
Lynn Burn Real Estate
2023 Downtown Minneapolis Real Estate in Review

2023 Downtown Minneapolis Real Estate in Review

  • January 4, 2024

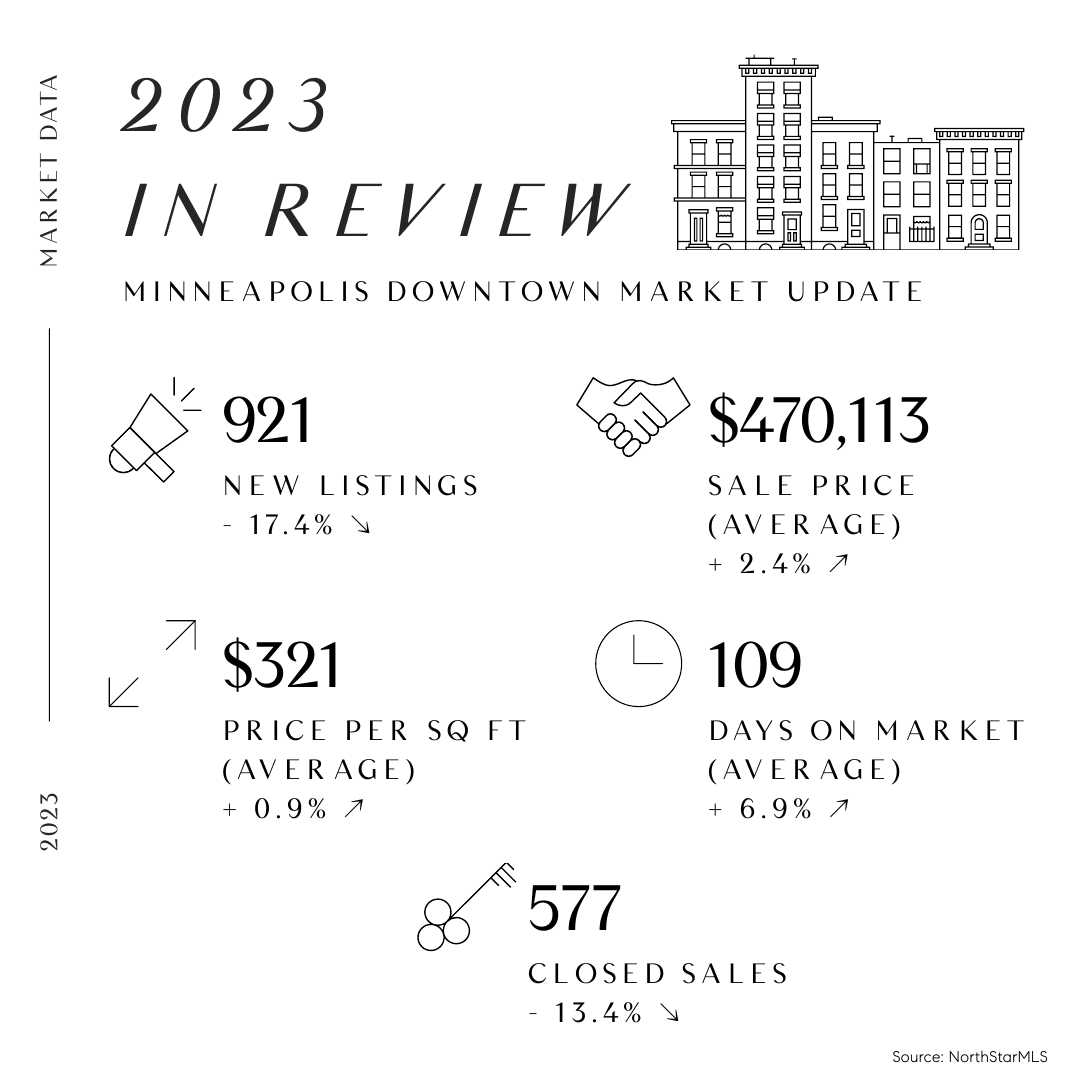
2023 downtown Minneapolis real estate market review infographic with annual listing, sale price, and market statistics.

Rolling 12-month charts below of the Downtown Minneapolis real estate market. Data retrieved from the NorthStarMLS 1/4/2024 with some variation anticipated between sources and interpretation.


 

Downtown average sales price chart, rising to $470,113 in December 2023, up 2.4%.

Downtown average price per square foot, ending at $321 in December 2023, up 0.9%.

Line chart of Downtown new listings, declining to 921 in December 2023, down 17.4%.

Chart of downtown closed sales, declining from about 940 in 2020 to 577 in December 2023.

Chart showing Downtown days on market rising to 109 in December 2023, up 6.9%.


Data retrieved from the NorthStarMLS via map of Downtown Minneapolis Neighborhoods including: Loring Park, Elliot Park, Downtown West, Central Minneapolis, North Loop, East Town, Mill District, Nicollet Island, St. Anthony West, and Marcy-Holmes.⁠


Do you have questions about Downtown Minneapolis or surrounding real estate markets?

Contact our team by call, email, or submitting a form at: https://lynnburnrealestate.com/

Work With Us

Etiam non quam lacus suspendisse faucibus interdum. Orci ac auctor augue mauris augue neque. Bibendum at varius vel pharetra. Viverra orci sagittis eu volutpat. Platea dictumst vestibulum rhoncus est pellentesque elit ullamcorper.

Follow Us on Instagram