

April 2025 Downtown Minneapolis Real Estate Market Overview
The Downtown Minneapolis real estate market in April 2025 exhibited notable shifts compared to April 2024, reflecting changes in inventory, pricing, and buyer behavior. Here's a detailed analysis:
📈 Key Market Metrics: April 2025 vs. April 2024
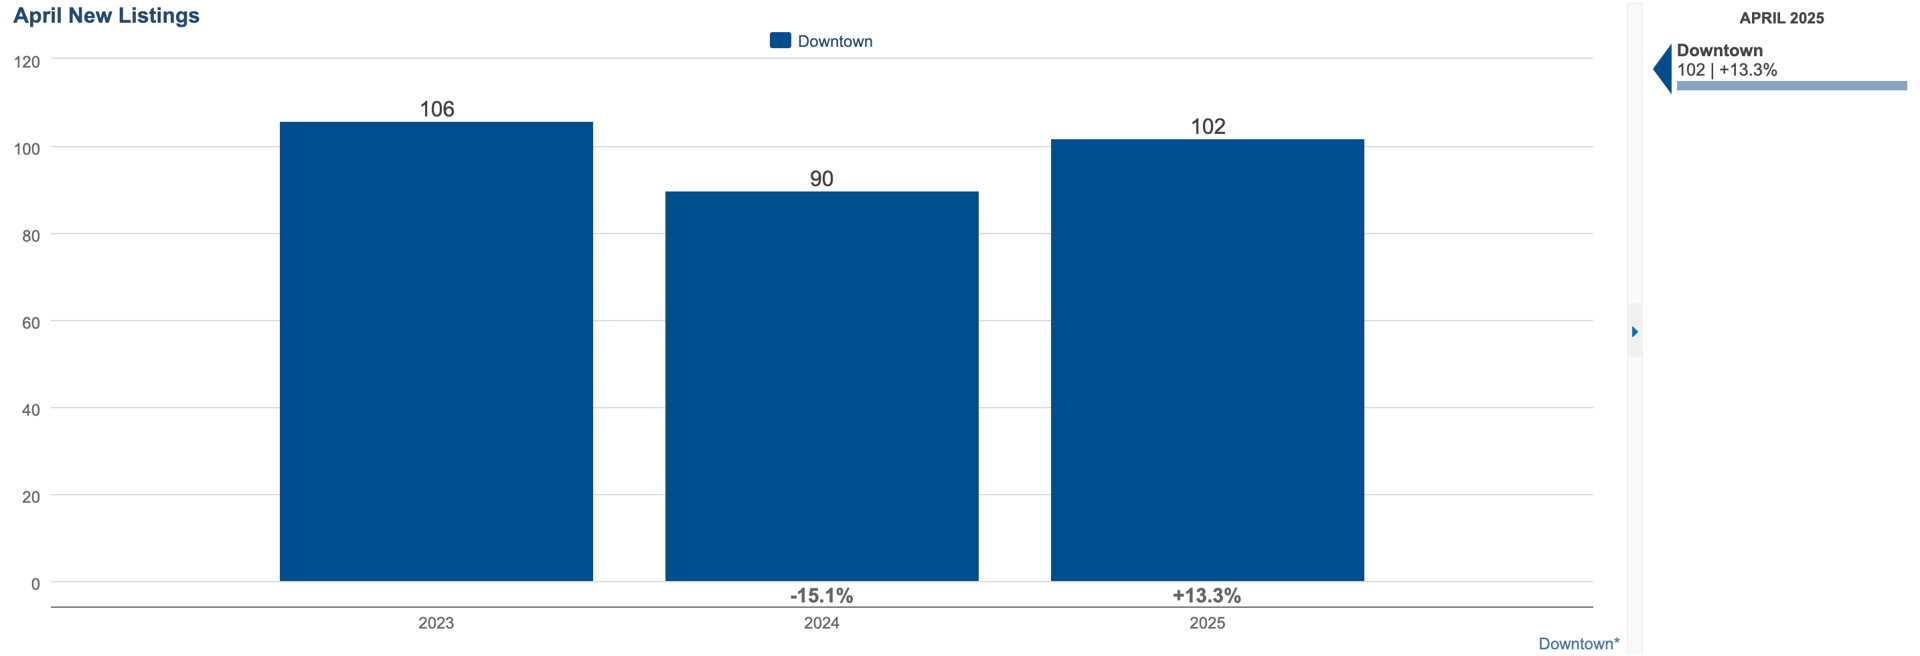
New Listings: More homes hit the market this April compared to April 2024. This increase reflects growing seller confidence, possibly due to seasonal activity and a still-engaged buyer pool. The higher number of listings can give buyers more options, and allows transactions to flow more swiftly, while also signaling increasing competition among sellers.
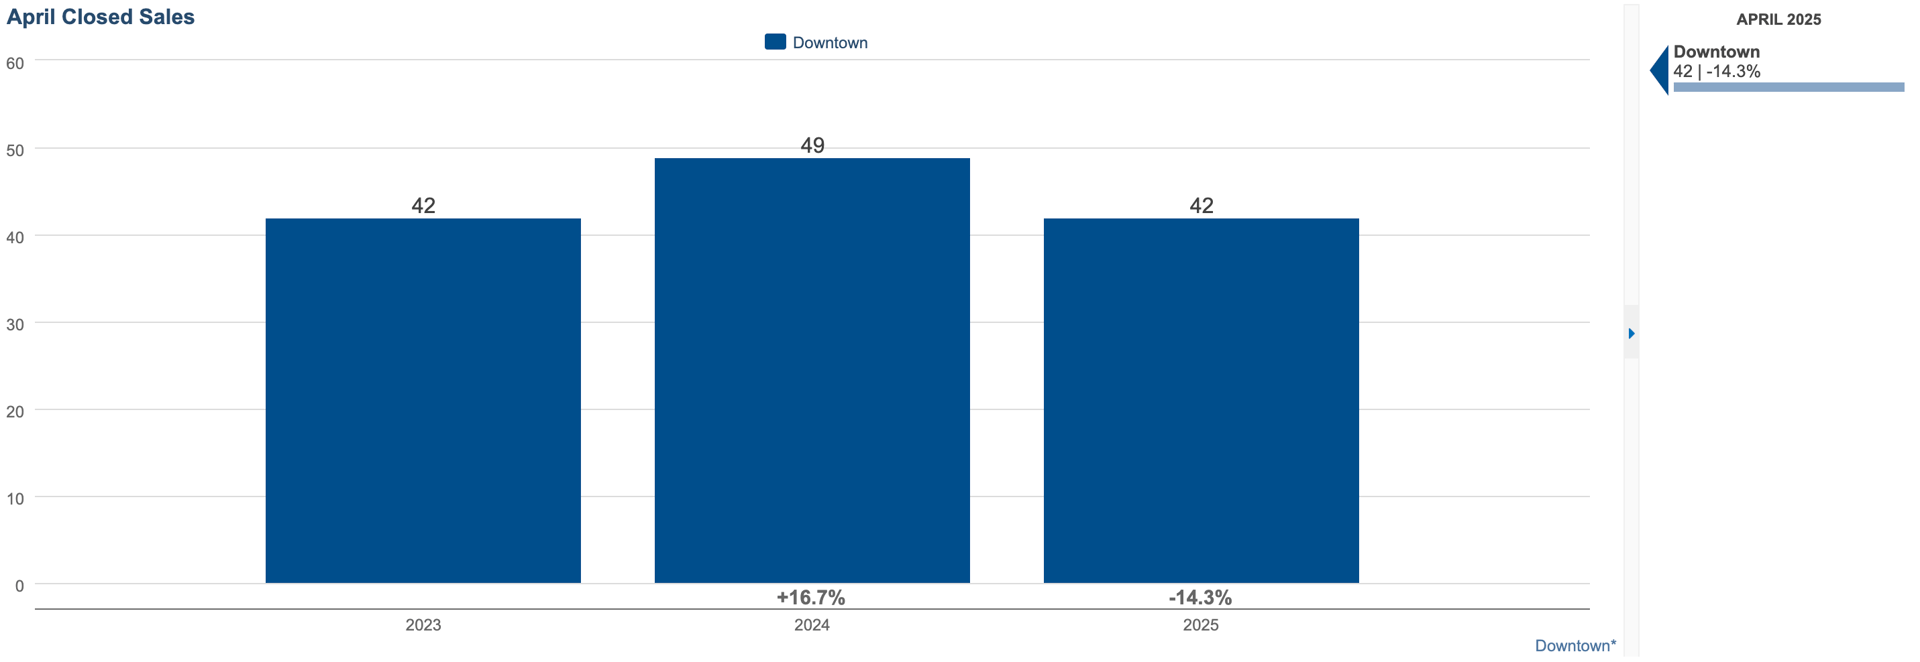
Closed Sales: Despite more listings, the number of closed sales dropped about 14%. This may indicate buyer hesitation, increased selectivity, or delays in transaction timelines. It’s not necessarily a sign of weak demand, but a potential recalibration in the pace of the market. We anticipate the luxury segment to remain strong heading into mid and late spring.
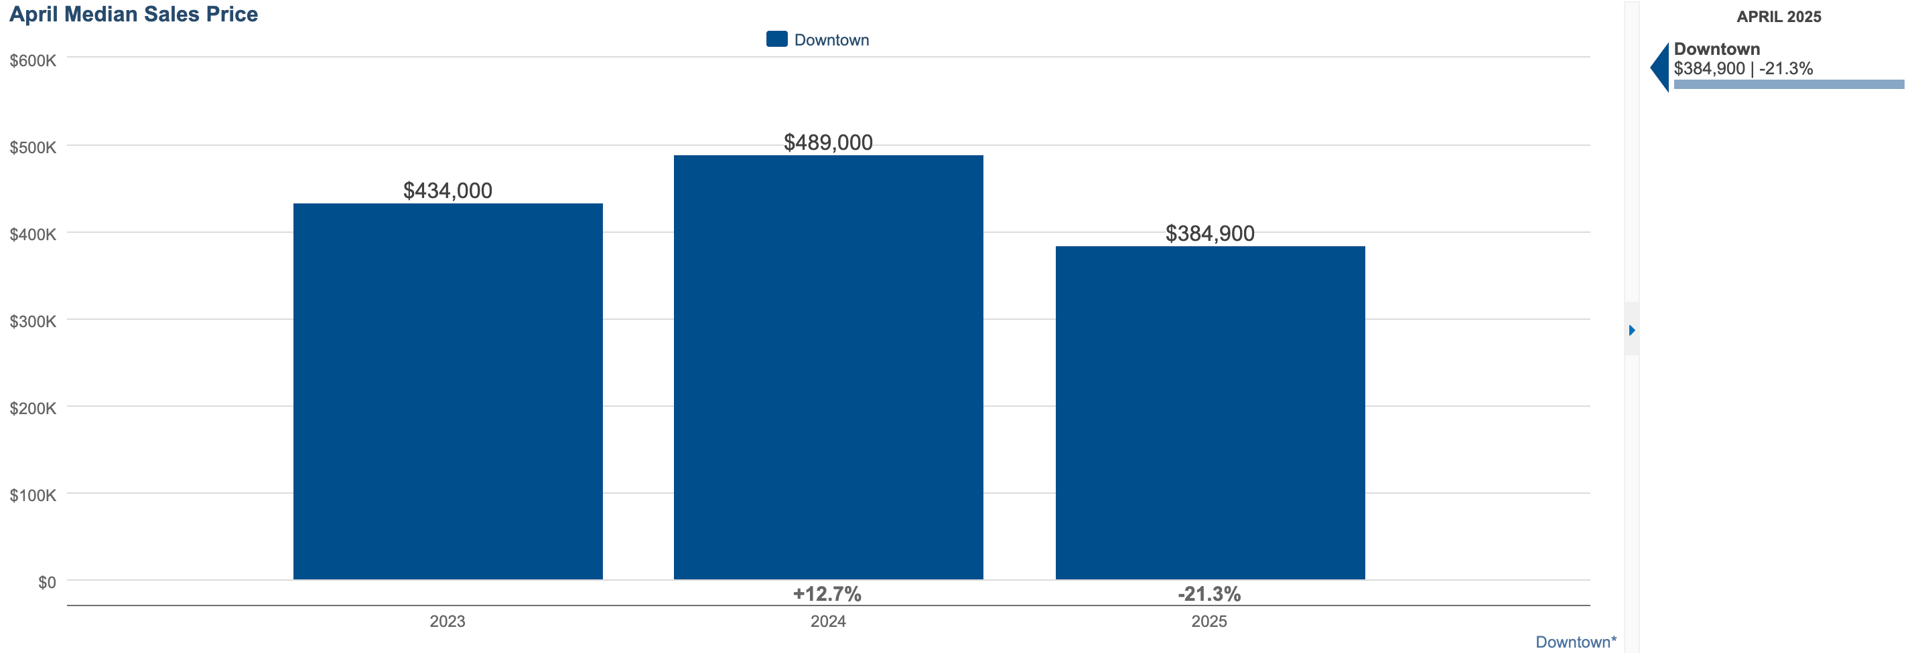
Median Sales Price: Dropped approximately 21%, primarily due to a reduction in luxury property sales dominating the market. This is one of the most significant shifts in the April data. The decline is likely attributable to fewer luxury listings and sales occurring this April compared to last year.
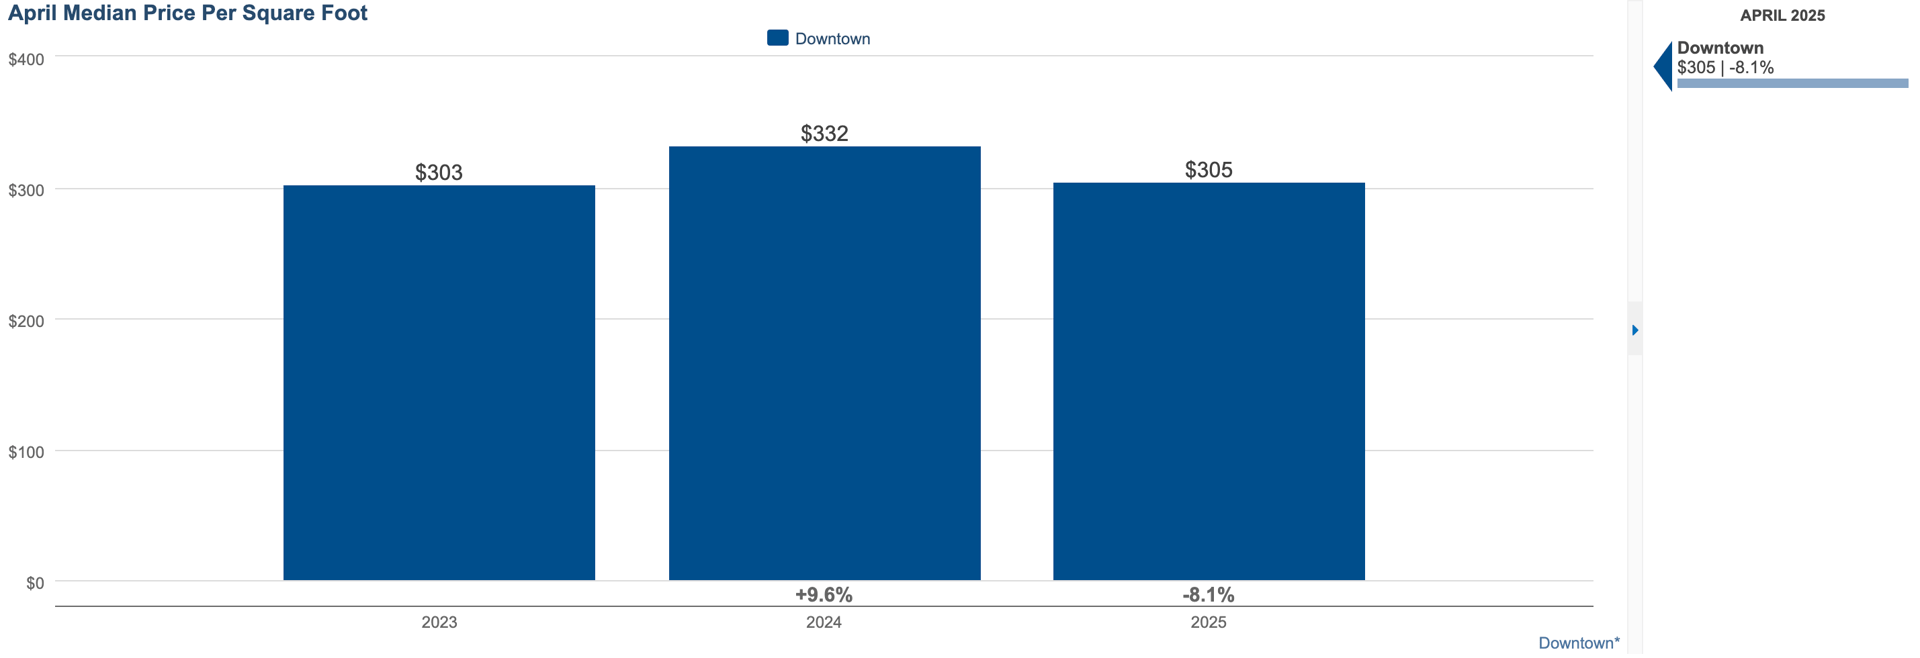
Median Price per Square Foot: Decreased by 8%, a smaller decline compared to the overall median sales price, indicating that while fewer high-end homes sold, the value per square foot remained relatively stable.
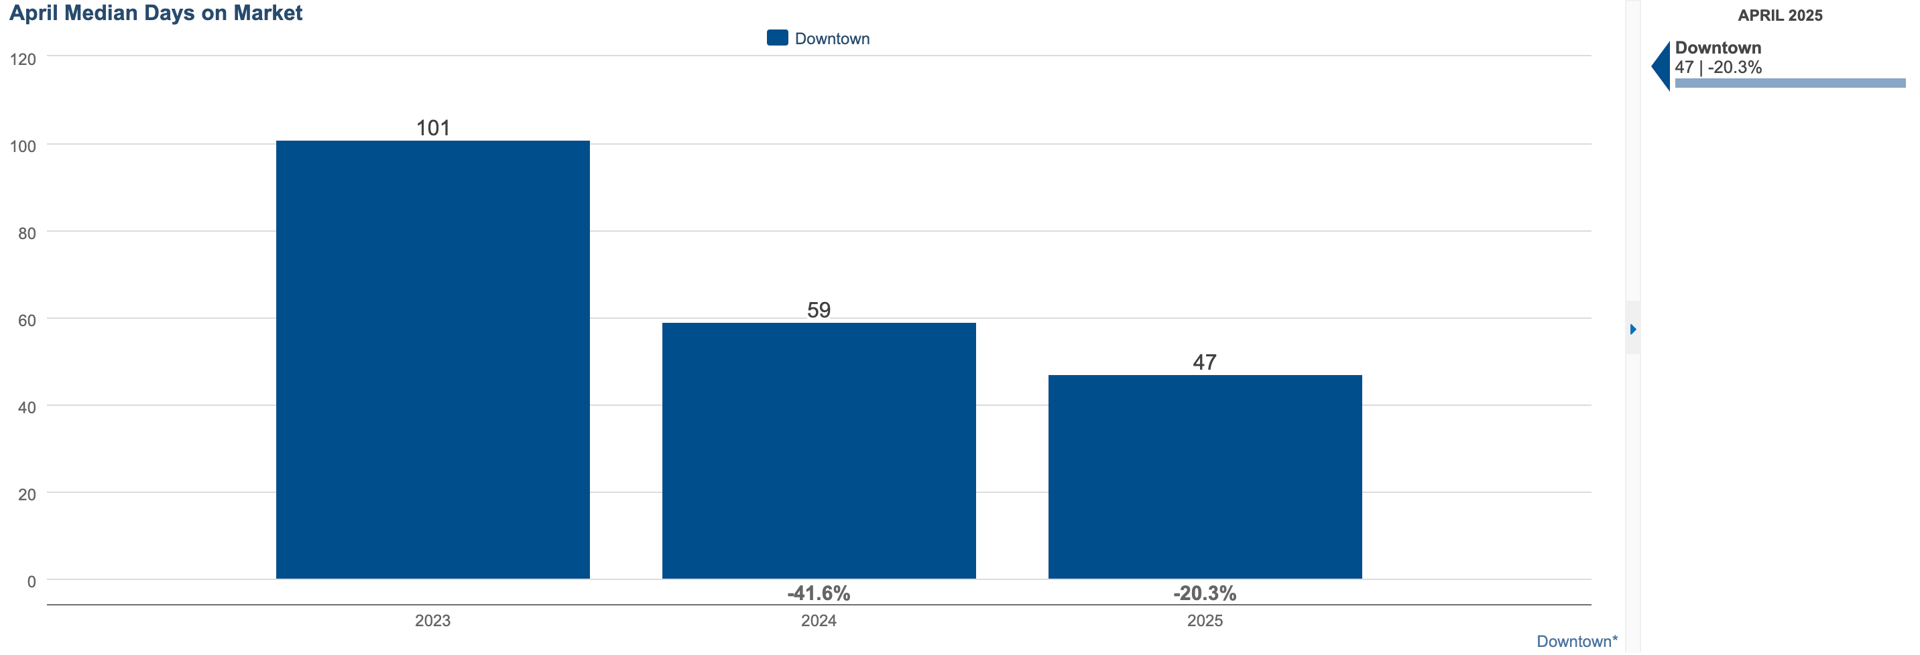
Median Days on Market: Reduced by over 20% to just 47 days, highlighting a quicker turnover and sustained buyer interest — well-prepared listings are moving quickly.
🔍 Market Insights
Shift in Luxury Sales in April: The significant drop in median sales price is largely attributed to a slight decrease in luxury property transactions this month. This shift has impacted the overall median, though the broader market remains active.
Stability in Price per Square Foot: The modest 8% decline in price per square foot suggests that properties are maintaining their value, reinforcing the market's resilience.
Accelerated Sales Pace: The reduction in days on market to 47 days indicates that homes are selling more quickly, reflecting strong demand and efficient market dynamics.
🏡 Implications for Buyers and Sellers
For Buyers: The increase in new listings provides more options in the spring, but the quicker sales pace means acting promptly is crucial.
For Sellers: While the luxury segment saw slightly less closed sales activity this month, the overall market remains robust. Properly priced and well-presented homes are selling faster, emphasizing the importance of strategic marketing and staging.
If you're curious about your home’s value or ready to explore your options, let's connect!
REACH OUT TO DISCUSS HOW THESE NUMBERS AFFECT YOUR MARKET TIMING AT [email protected]
Data retrieved from the NorthStarMLS via map of Downtown Minneapolis Neighborhoods including: Loring Park, Elliot Park, Downtown West, Central Minneapolis, North Loop, East Town, Mill District, Nicollet Island, St. Anthony West, and Marcy-Holmes.
HAVE QUESTIONS ABOUT DOWNTOWN MINNEAPOLIS OR SURROUNDING REAL ESTATE MARKETS?
Contact our team by call, email, or submitting a form at: https://lynnburnrealestate.com/