

This May, the Downtown Minneapolis market continued to demonstrate a theme we've seen throughout much of 2026: steady/increasing inventory, a pool of more selective buyers, and pricing that remains remarkably resilient despite slightly softer sales volume.
At first glance, May's numbers may seem mixed. Listings increased, sales declined, and homes took slightly longer to sell. Yet beneath those figures lies a market that is finding a gentle equilibrium rather than experiencing weakness. Buyers have more choices, sellers face more competition, and successful transactions are increasingly driven by strategy rather than urgency.
New Listings
May 2026: 108 (+8.0% YoY)
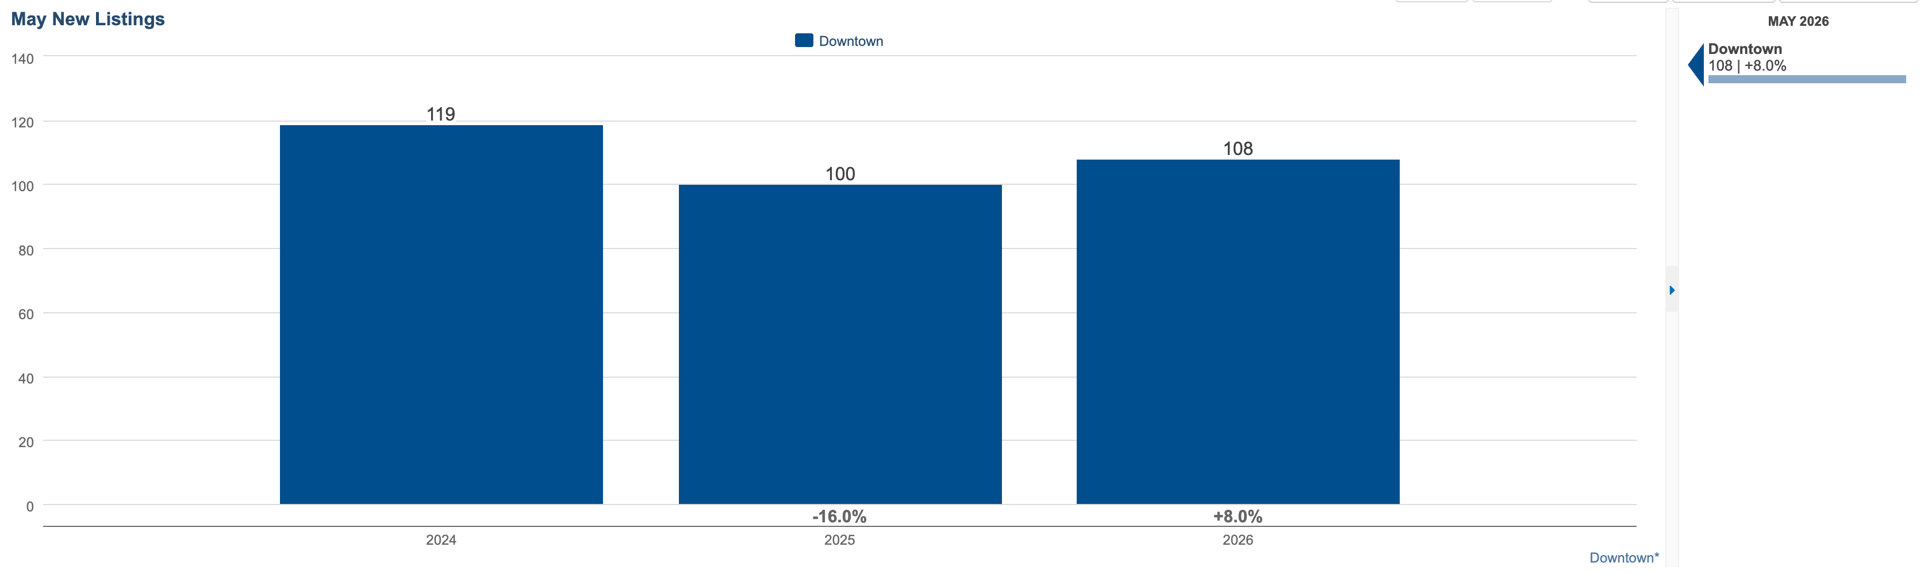
New listings increased compared to May of last year, providing buyers with additional options heading into the traditionally active summer season.
This slight rise in inventory is a healthy sign for Downtown Minneapolis. After several years of fluctuating supply, slightly more homeowners are choosing to enter the market than last May, creating greater opportunity and variety for prospective buyers.
For sellers, however, more inventory means more competition. Standing out through thoughtful presentation, pricing, and marketing remains essential.
Closed Sales
May 2026: 43 (-33.8% YoY)
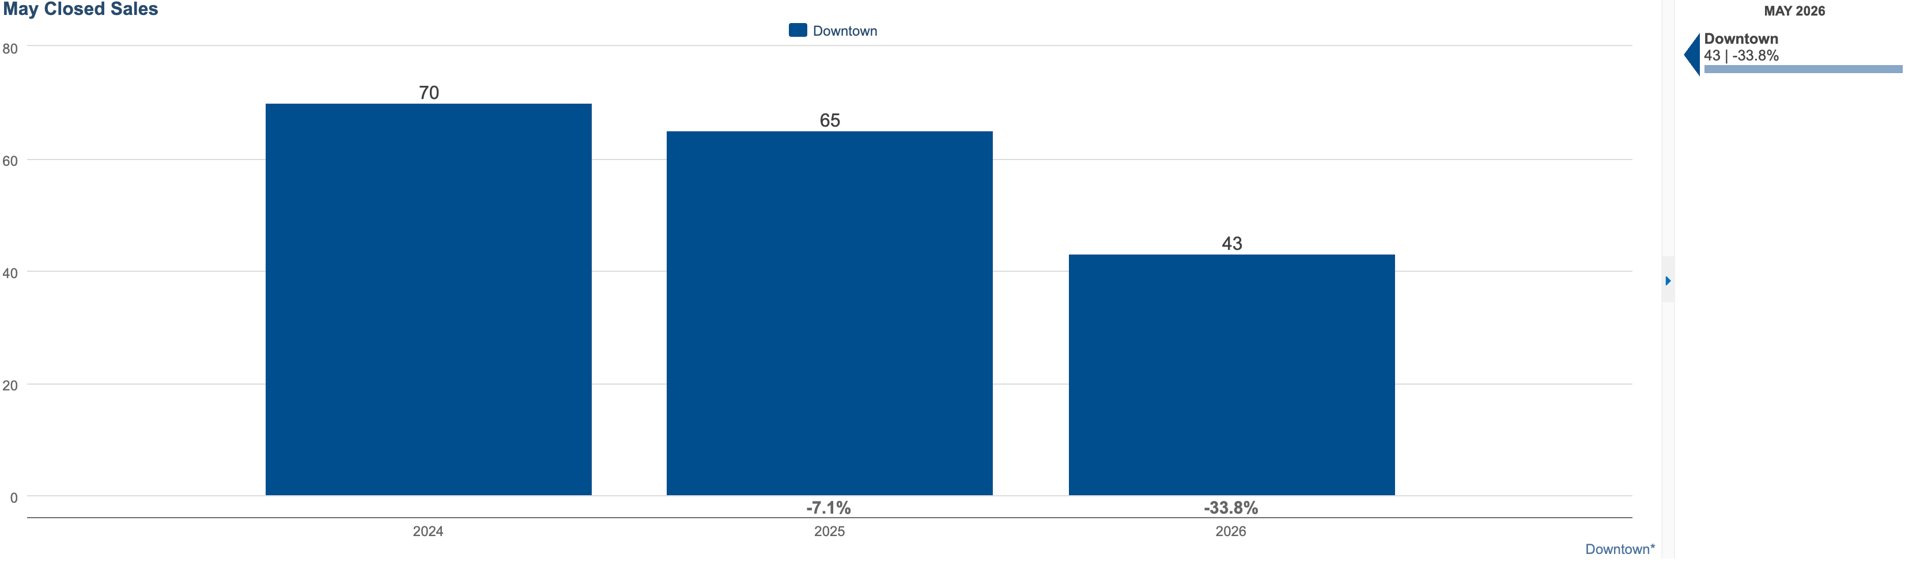
Closed sales experienced the largest shift this month, falling significantly compared to May 2025.
While this decline reflects a more cautious buyer pool, it does not necessarily indicate a lack of demand. Early spring weather had a significant impact on list dates. Many buyers continue to engage with the market but are taking a little longer to make decisions, carefully comparing options and evaluating long-term value before moving forward.
This dynamic has become increasingly common throughout downtown over the past year: activity is present, but the pace is more deliberate.
Median Days on Market
May 2026: 63 Days (+21.2% YoY)
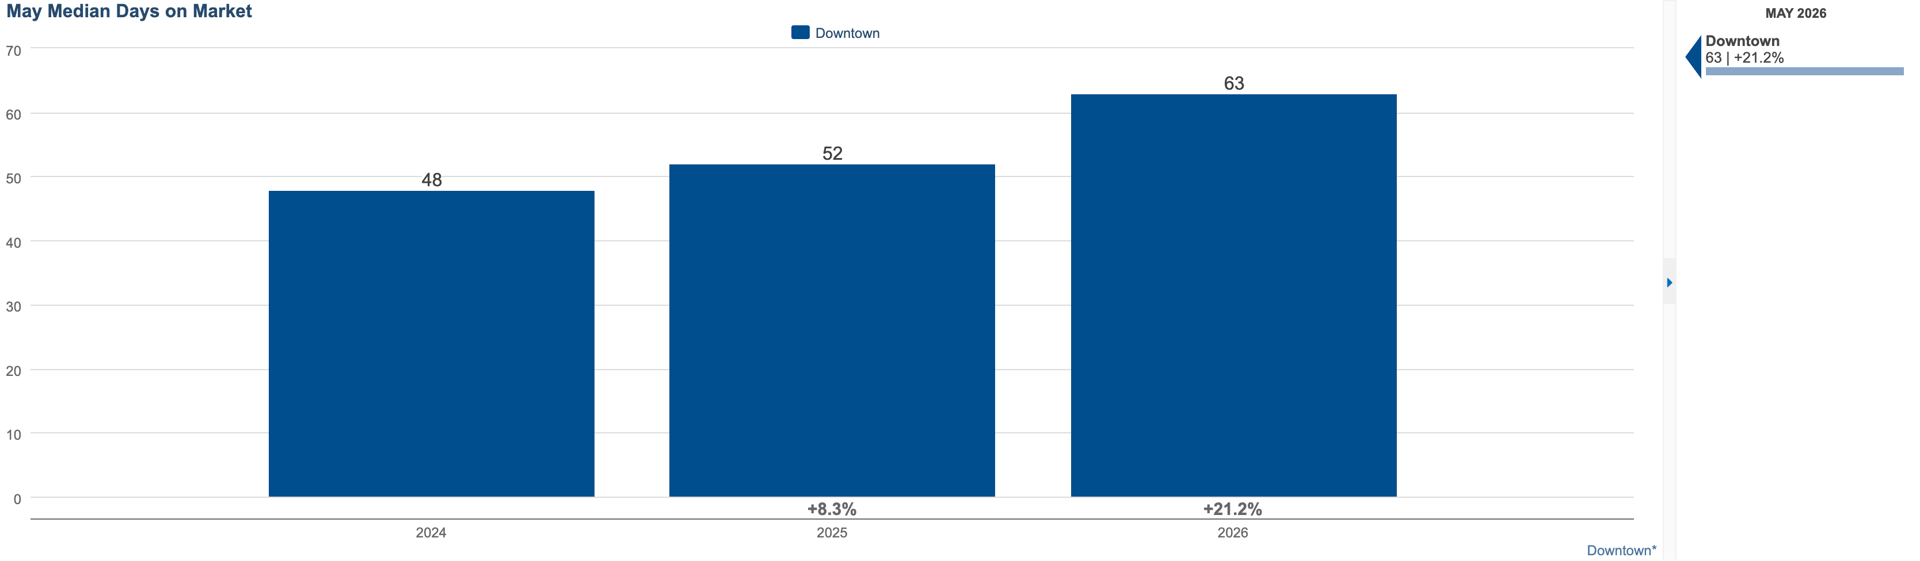
Properties spent slightly longer on the market than they did a year ago, though the increase remains moderate by historical standards.
Today's buyers are often viewing multiple properties, analyzing HOA structures, comparing building amenities, and evaluating future resale potential before committing. As a result, the decision-making process has lengthened.
The good news for sellers is that 63 days remains a reasonable timeline for an urban condominium market, particularly in an environment where buyers have more options.
Median Sales Price
May 2026: $380,000 (+8.6% YoY)
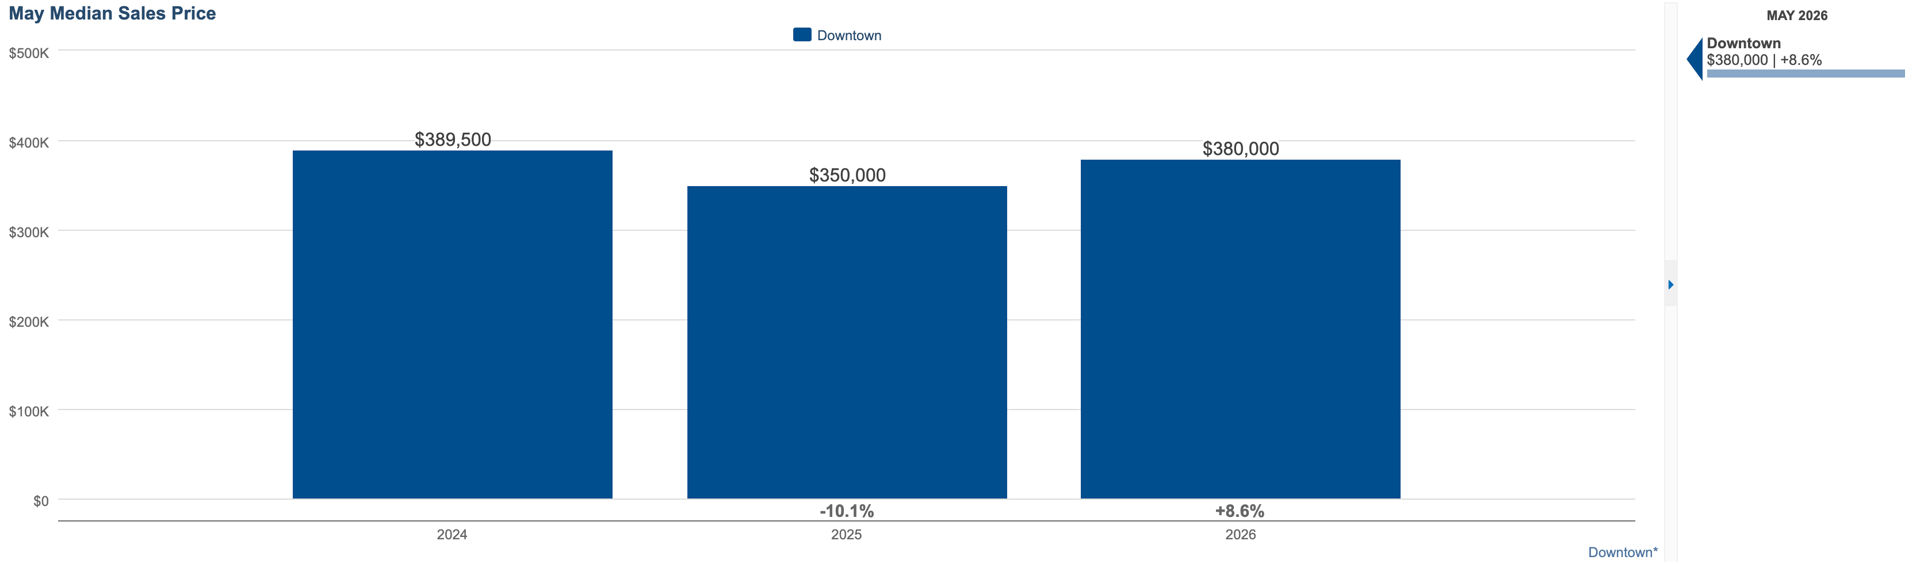
One of the most encouraging indicators this month is the increase in median sales price.
Despite fewer overall transactions, pricing moved higher year-over-year, suggesting that desirable properties continue to attract strong interest. Updated residences, premium locations, superior views, and sought-after building amenities remain highly valued by buyers.
This increase reinforces the notion that Downtown Minneapolis pricing has remained surprisingly durable even as transaction volume has softened.
Median Price Per Square Foot
May 2026: $299 (-3.2% YoY)
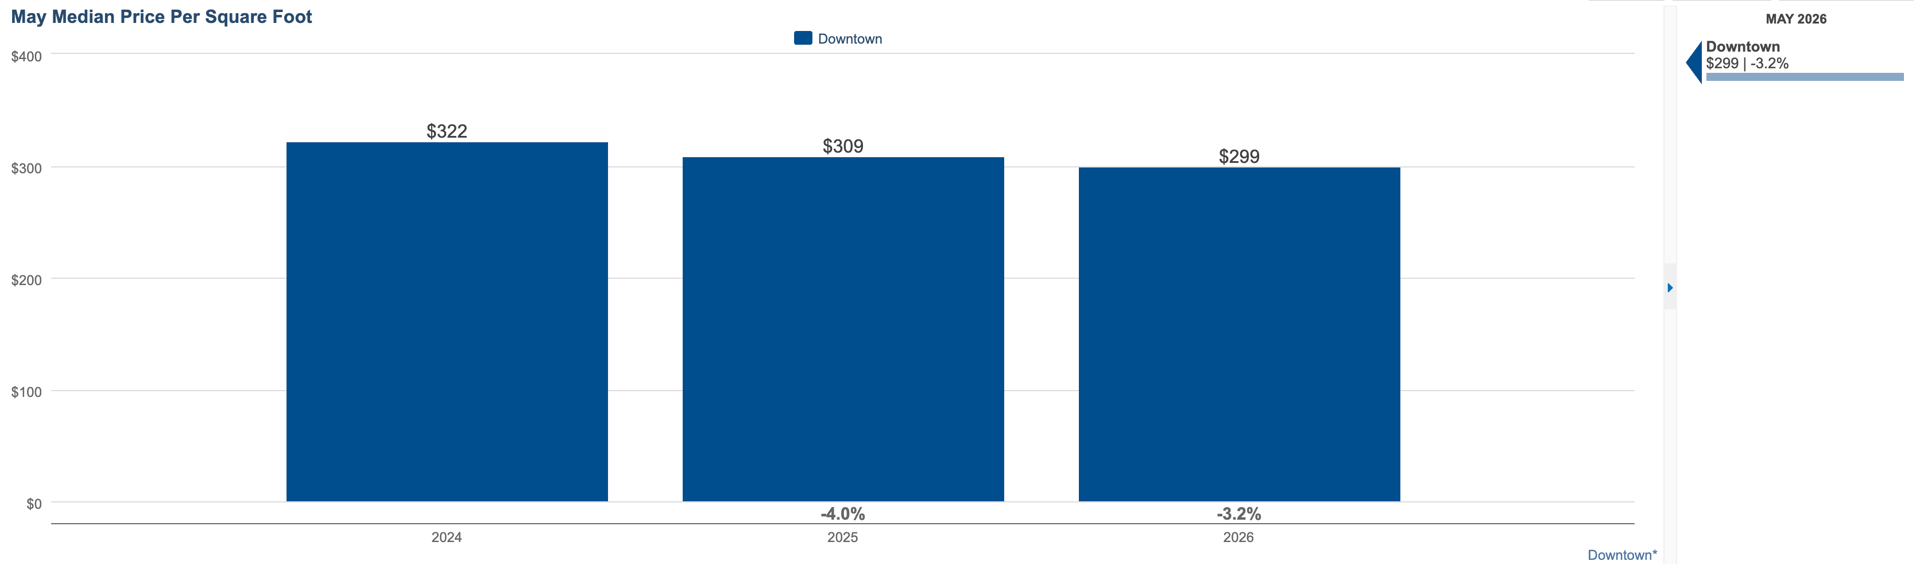
Price per square foot declined modestly, indicating buyers are still placing a premium on overall value.
This can occur even alongside rising median sales prices, particularly when larger units account for a greater share of closed sales. Buyers continue to prioritize livability, functionality, and space, often seeking properties that offer long-term versatility rather than simply the newest finishes.
The result is a market where value remains a driving force behind purchasing decisions.
The Broader Picture
May's data illustrates a Downtown Minneapolis market that is balancing itself.
Inventory is modestly growing. Buyers have more choices. Sales are taking slightly longer to materialize, but are not stagnant. Yet pricing remains remarkably stable.
For Downtown specifically, this reflects the continued appeal of urban living with excellent layouts, amenities, and presentation. The North Loop, Mill District, riverfront neighborhoods, and surrounding downtown districts continue to attract buyers seeking walkability, convenience, cultural amenities, and a lock-and-leave lifestyle.
What we're seeing is not a market losing its footing. Rather, it's a market where buyers have regained some negotiating power and sellers must be increasingly thoughtful in their presentation to achieve optimal results.
As we move into the summer months, the key theme remains preparation. Buyers who understand value and sellers who position their properties effectively are finding success, even in a market that requires a bit more patience than it once did.
REACH OUT TO DISCUSS HOW THESE NUMBERS AFFECT YOUR MARKET TIMING AT [email protected]
Data retrieved from the NorthStarMLS via map of Downtown Minneapolis Neighborhoods including: Loring Park, Elliot Park, Downtown West, Central Minneapolis, North Loop, East Town, Mill District, Nicollet Island, St. Anthony West, and Marcy-Holmes.
HAVE QUESTIONS ABOUT DOWNTOWN MINNEAPOLIS OR SURROUNDING REAL ESTATE MARKETS?
Contact our team by call, email, or submitting a form at: https://lynnburnrealestate.com/