

October brought a mixed dataset for the Downtown Minneapolis real estate market. New listings and closed sales were down compared with October 2025, and the median sales price saw a notable year-over-year decline. However, homes that sold spent less time on the market, and the median price per square foot increased.
With six months of housing supply, the market is holding at a level comparable to October 2024. Together, these numbers point to a market where activity is more measured, but well-positioned properties continue to find buyers. Looking beyond the headline sale price reveals a more nuanced picture of what is happening across Downtown Minneapolis.
New Listings
69 | -14.8% year over year
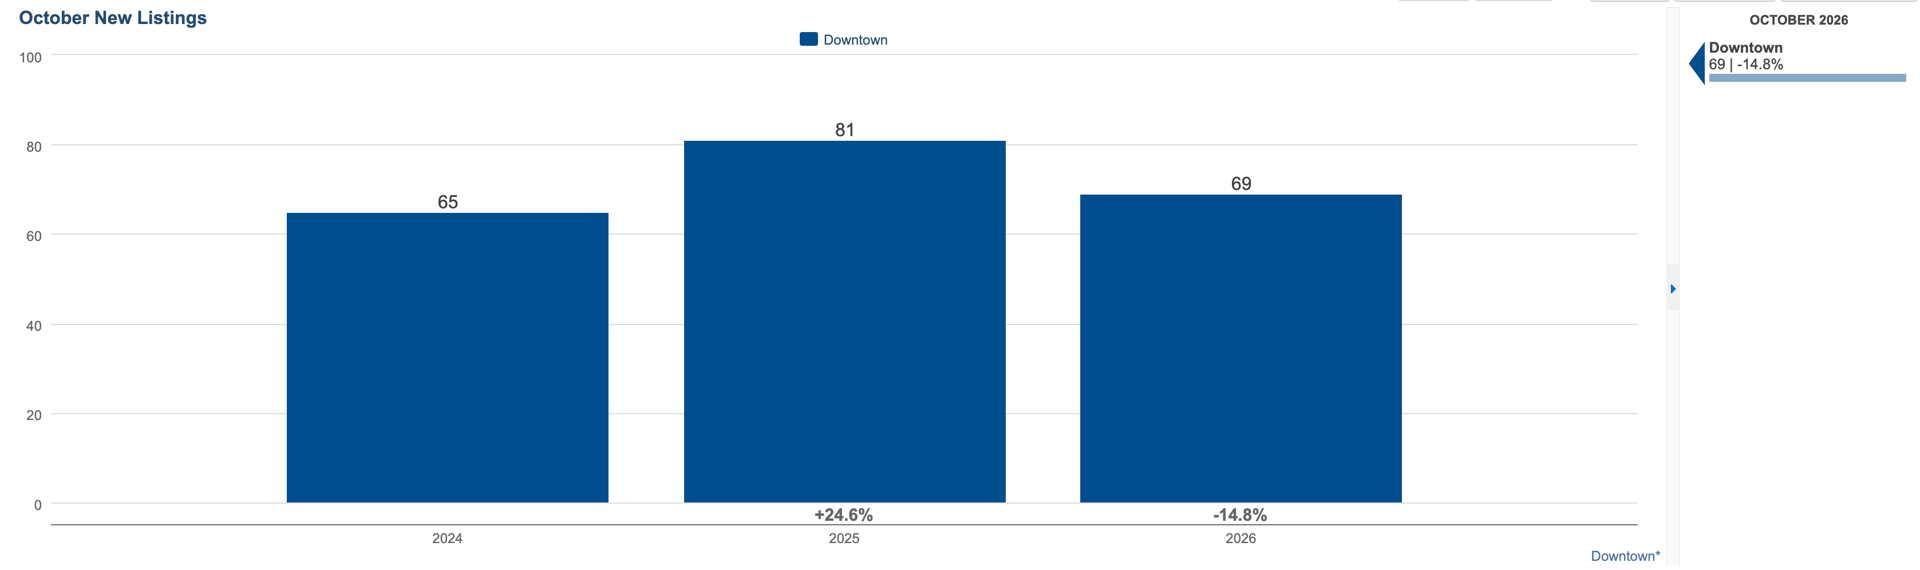
There were 69 new listings in October, down 14.8% from October 2025. However, new listings were slightly higher than in October 2024, offering a useful longer-term perspective.
Fewer new listings can mean fewer newly available options for buyers, but the broader inventory picture also matters. In a market with a range of condominium buildings, townhomes, and price points, the opportunities available can vary considerably by location and property type.
Closed Sales
29 | -29.3% year over year
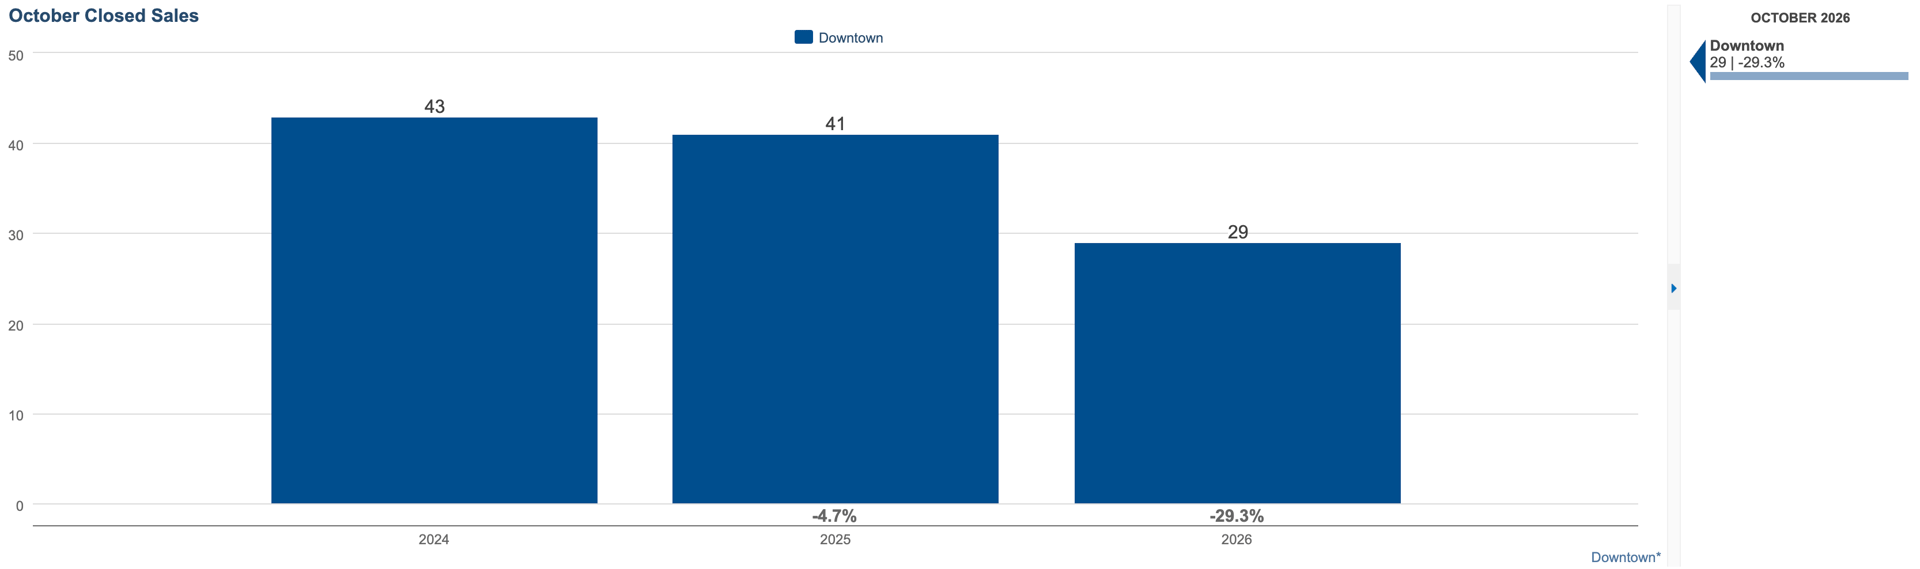
Closed sales declined compared with October 2025, with 29 properties closing during the month.
This points to a slower pace of completed transactions, though one month's sales volume does not tell the entire story. Buyer activity in Downtown Minneapolis can vary by season, price range, building, and the characteristics of the properties available.
For sellers, this makes it especially important to understand the competition within their specific segment of the market rather than relying solely on broad downtown averages.
Median Days on Market
67 days | -33.7% year over year
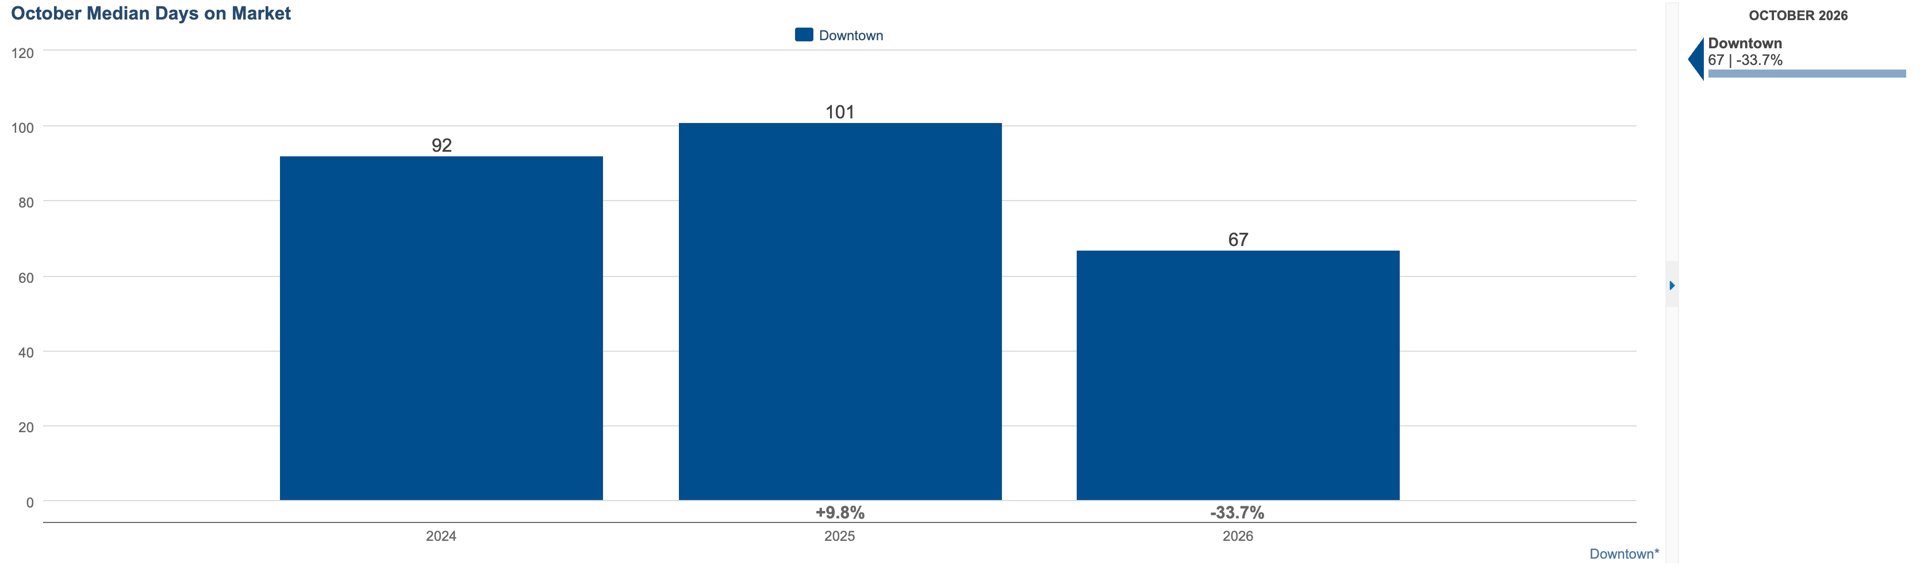
One of October's more encouraging indicators was the reduction in median days on market. Properties that sold spent a median of 67 days on the market, down 33.7% from the same month last year.
Despite fewer closed sales, the homes that did sell moved more quickly. This suggests that buyers are continuing to act when they find a property that aligns with their needs, expectations, and budget.
For sellers, competitive pricing and thoughtful presentation remain important in helping a property stand out and connect with the right buyer.
Median Sales Price
$365,000 | -21.5% year over year
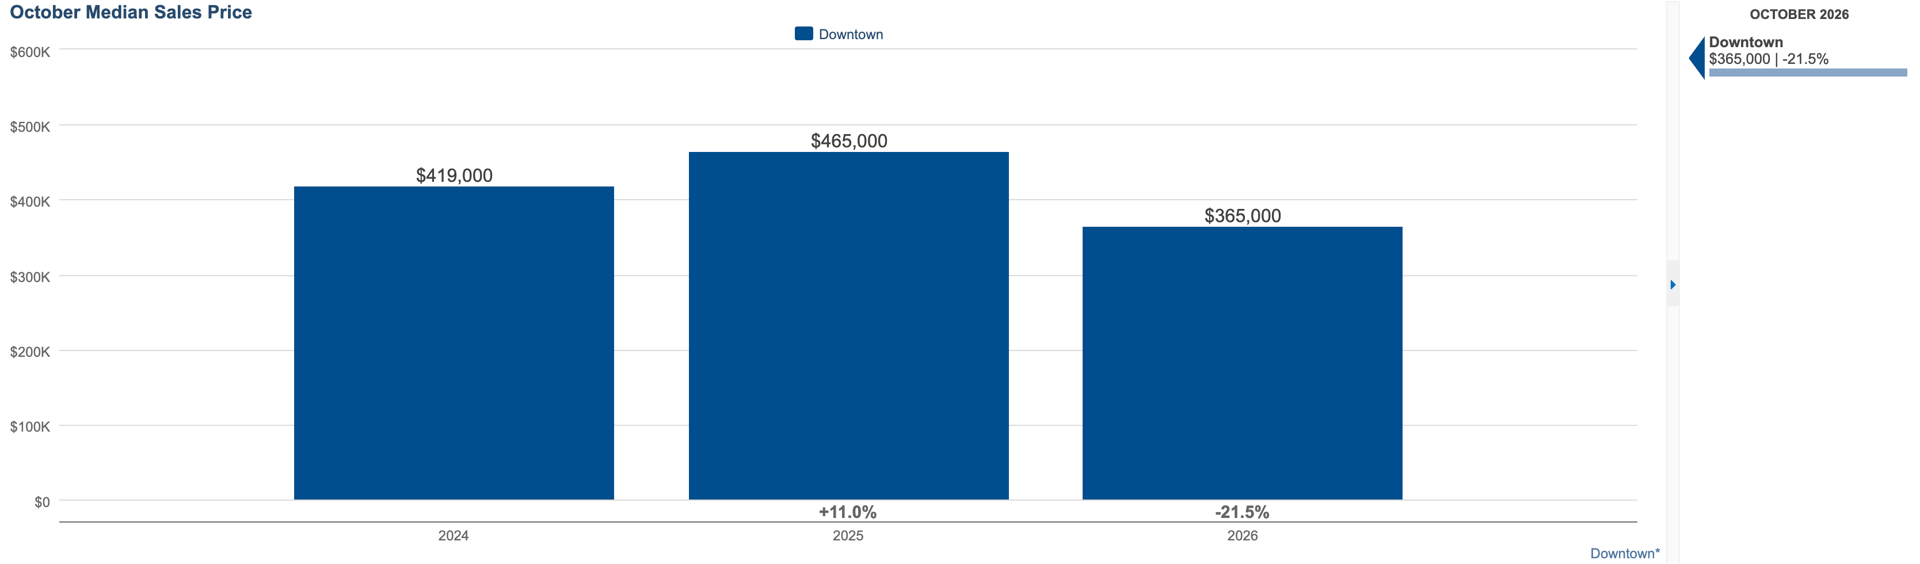
The median sales price was $365,000, a 21.5% decrease from October 2025.
While this is a significant perceived jump, median sale price is influenced by the mix of properties that close during a given month. Downtown Minneapolis includes everything from smaller condominium residences to larger luxury homes and townhomes, so a shift in the types, sizes, or price points of properties sold can have a meaningful effect on the monthly median.
Another useful measure is price per square foot, which offers additional context for understanding pricing trends.
Median Price Per Square Foot
$300 | +4.5% year over year
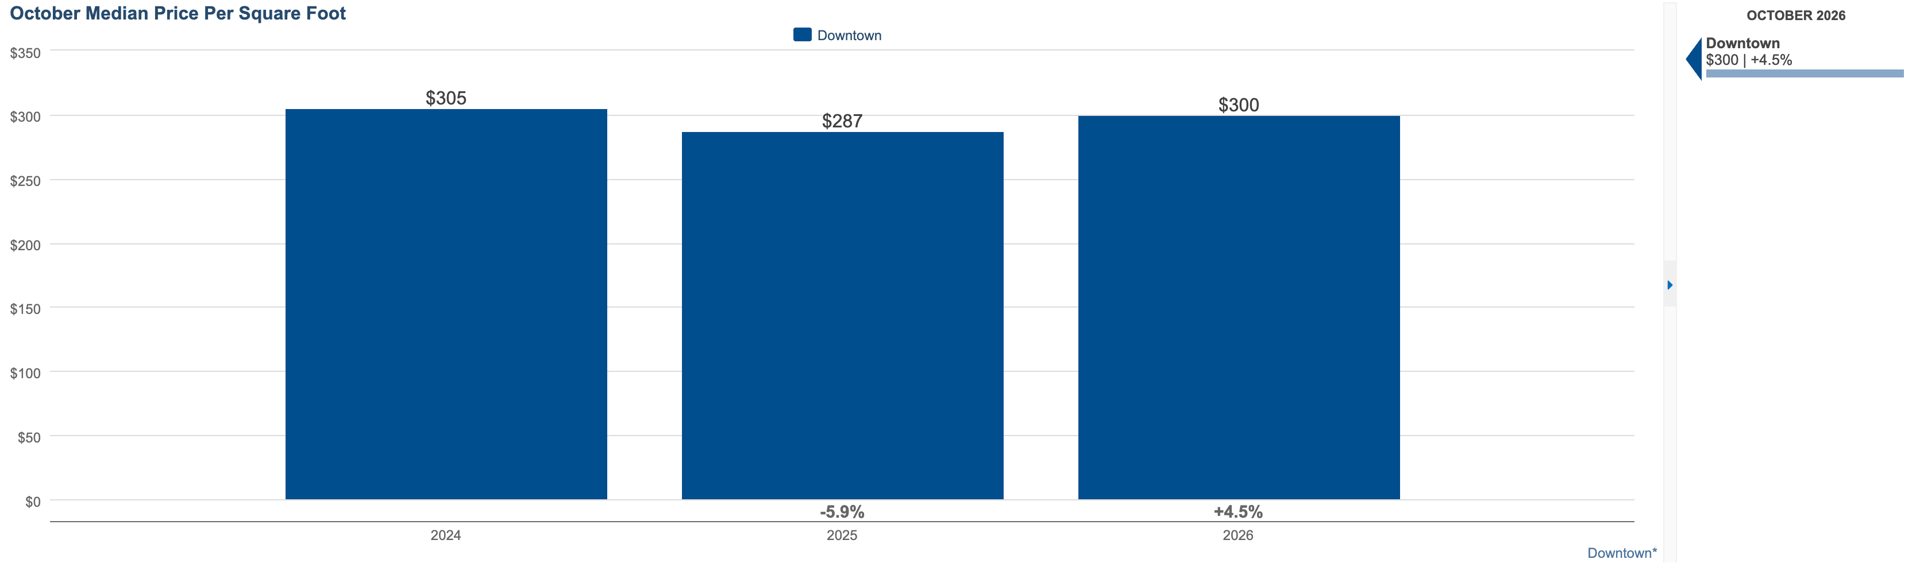
While the median sales price declined, the median price per square foot increased 4.5% to $300.
These two figures measure different things. Median sales price reflects the overall price of the homes sold, while price per square foot provides a relative measure of value based on property size. The increase in price per square foot suggests that the lower median sale price does not necessarily reflect a comparable decline in pricing on a per-square-foot basis.
Looking at both metrics together gives buyers and sellers a more complete understanding of the market - and reinforces why individual property comparisons are so important.
Inventory & Supply
6 months of supply | +3.4% year over year
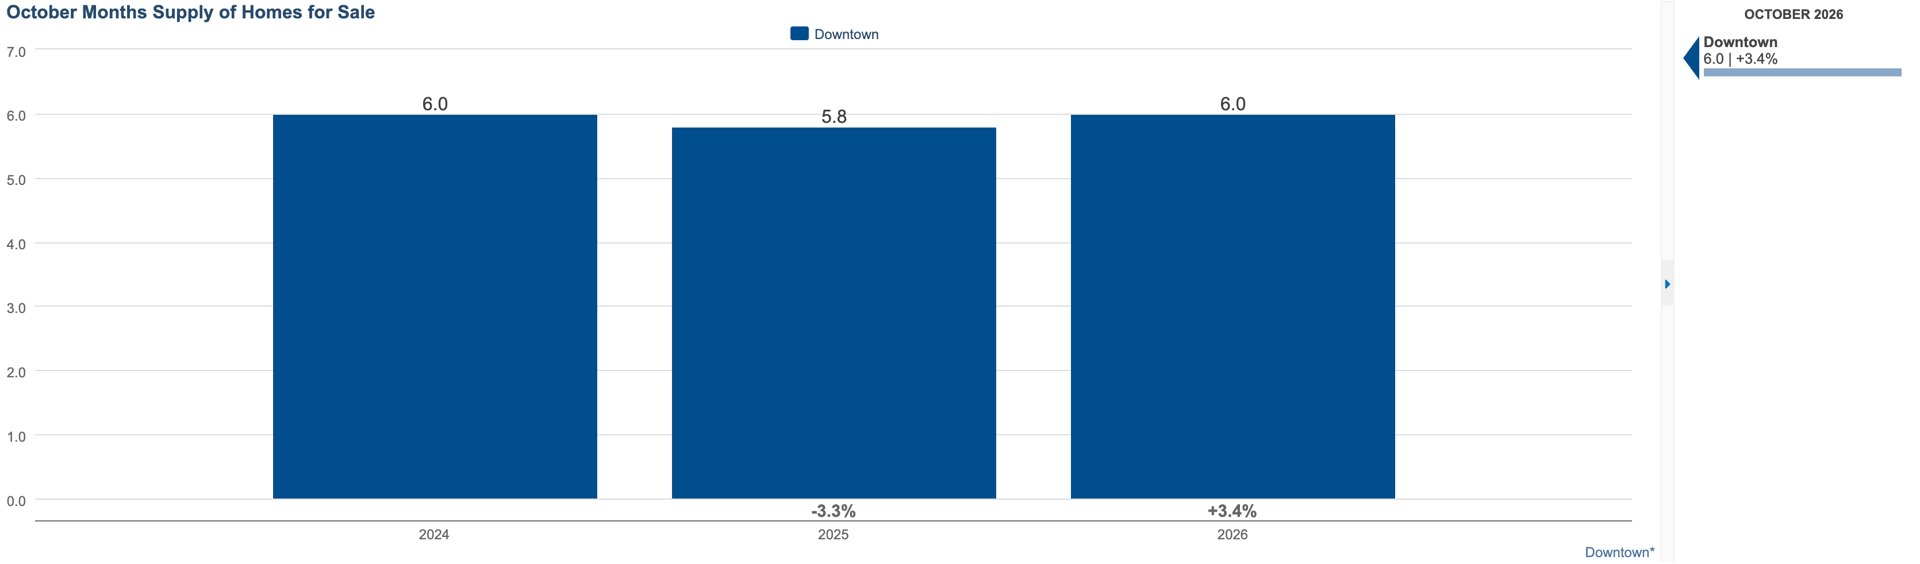
Downtown Minneapolis had six months of housing supply in October, up just 3.4% from October 2025 and essentially in line with October 2024.
This provides a helpful measure of the relationship between available inventory and the pace of sales. Rather than looking only at how many new listings entered the market, months of supply helps illustrate the broader balance between what is available and how quickly properties are selling.
For buyers, this means there is a bit of room to be thoughtful and evaluate the options available. For sellers - understanding the competition, and how a property compares within its building and neighborhood, remains essential.
The Broader Picture
October's numbers tell a story of a more measured market, but not one without encouraging signs. Closed sales and the median sales price were lower than a year ago, while properties that sold moved considerably faster and median price per square foot increased. Inventory remained steady at approximately six months of supply.
For Downtown Minneapolis, the broader numbers are only part of the picture. A townhome in the North Loop may compete in a very different market than a home in the Mill District, and Downtown West. Building amenities, association fees, condition, views, parking, and pricing all influence how buyers evaluate a property.
As we move into the final months of 2026, the opportunity is to approach the market with a clear understanding of both the larger trends and the details that make each property unique. Whether buying or selling, informed decisions and thoughtful positioning will continue to matter.
REACH OUT TO DISCUSS HOW THESE NUMBERS AFFECT YOUR MARKET TIMING AT [email protected]
Data deemed reliable but not guaranteed, retrieved from the NorthStarMLS via map of Downtown Minneapolis neighborhoods including: Loring Park, Elliot Park, Downtown West, Central Minneapolis, North Loop, East Town, Mill District, Nicollet Island, St. Anthony West, and Marcy-Holmes.
HAVE QUESTIONS ABOUT DOWNTOWN MINNEAPOLIS OR SURROUNDING REAL ESTATE MARKETS? Contact our team by call, email, or submitting a form at: https://lynnburnrealestate.com/