

As we close the book on 2025, Downtown Minneapolis real estate tells a story of recalibration rather than retreat. After several years of relatively dramatic swings, the market has moved into a more balanced, data-driven phase — one that rewards strategy, pricing precision, and hyper-local expertise. Below is my breakdown of the most important year-end data points and what they actually mean for buyers, sellers, and owners downtown.
New Listings: Supply Continues to Climb (But Intentionally)
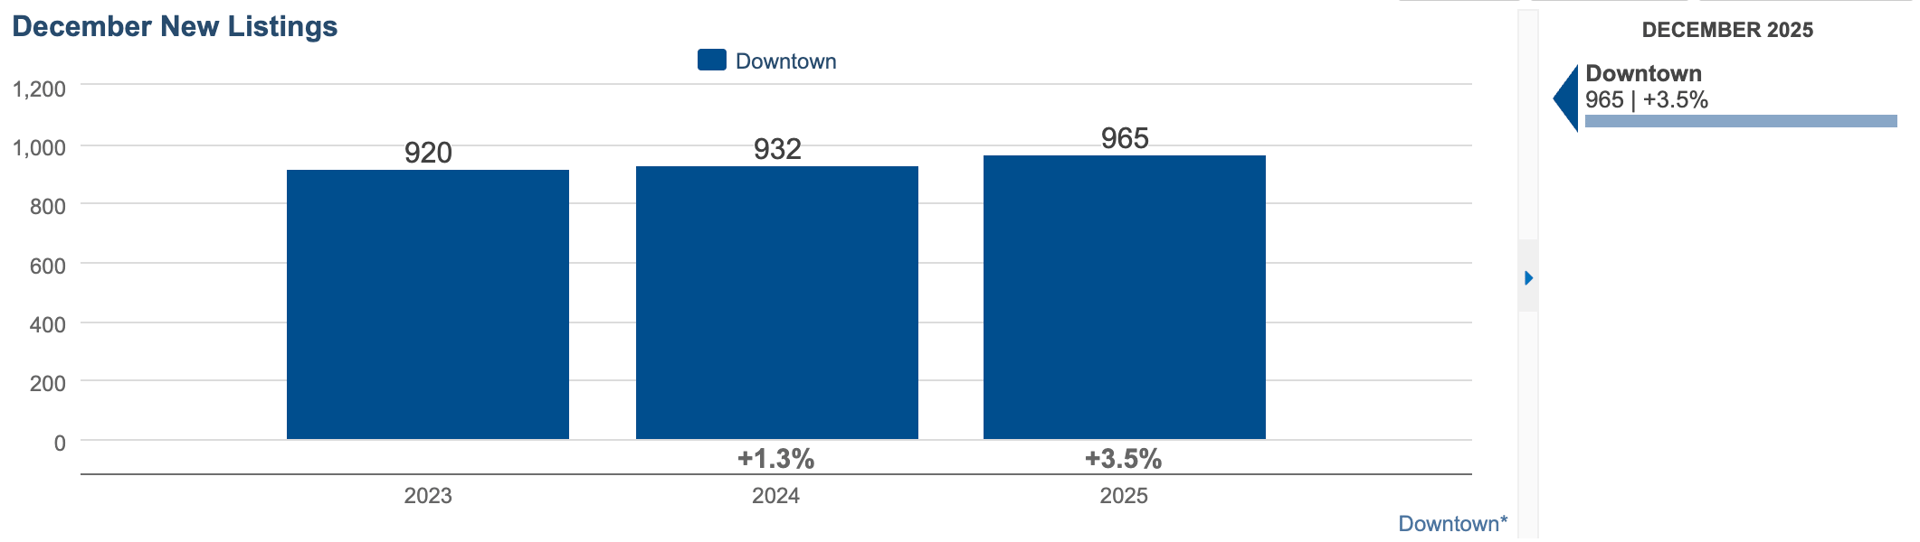
956 new listings came to market in 2025, up 3.5% from 2024 (932) and higher than 2023 (920).
This steady rise signals renewed seller confidence — particularly among condo owners who paused plans during higher rate volatility. Importantly, this wasn’t a flood of distressed inventory. Most listings were discretionary sellers responding to improved clarity around rates, values, and buyer activity.
What it means: More choice for buyers, but also more competition for sellers. Preparation and positioning mattered more than ever in 2025 — and that trend will continue.
Total Homes for Sale: Inventory Builds, Pressure Eases
Downtown ended the year with 245 homes for sale, an 8.4% increase over 2024 (226) and notably higher than 2023 (220).
This inventory growth outpaced new listings alone, reflecting slightly slower absorption and longer decision cycles from buyers. That shift eased the extreme pressure we saw in earlier years and created a more negotiable environment.
What it means: We’re no longer in a scarcity-driven market. Buyers gained leverage, and sellers had to earn attention through pricing, condition, and presentation.
Closed Sales: Healthy Activity, Closely Tracking New Supply

There were 535 closed sales in 2025—up 3.5% from 2024 (517), though still below 2023’s 577 sales.
The key takeaway here is alignment: closed sales rose at nearly the same pace as new listings. That balance is a hallmark of a stabilizing market.
What it means: Demand is present and consistent. Well-priced, well-marketed homes continued to sell — often quietly and efficiently — while overpriced listings sat.
Months Supply: Market Balance Achieved
Months supply increased 7.8% to 5.5 months, placing Downtown Minneapolis firmly in balanced-market territory.
Traditionally:
-
0–4 months = Seller’s market
-
4–6 months = Balanced market
-
6+ months = Buyer’s market
At 5.5 months, Downtown has transitioned out of seller dominance and into equilibrium.
What it means: Neither side holds all the cards. Strategy, timing, and expert guidance now matter more than market momentum.
Median Sales Price: A Strategic Reset, Not a Slide
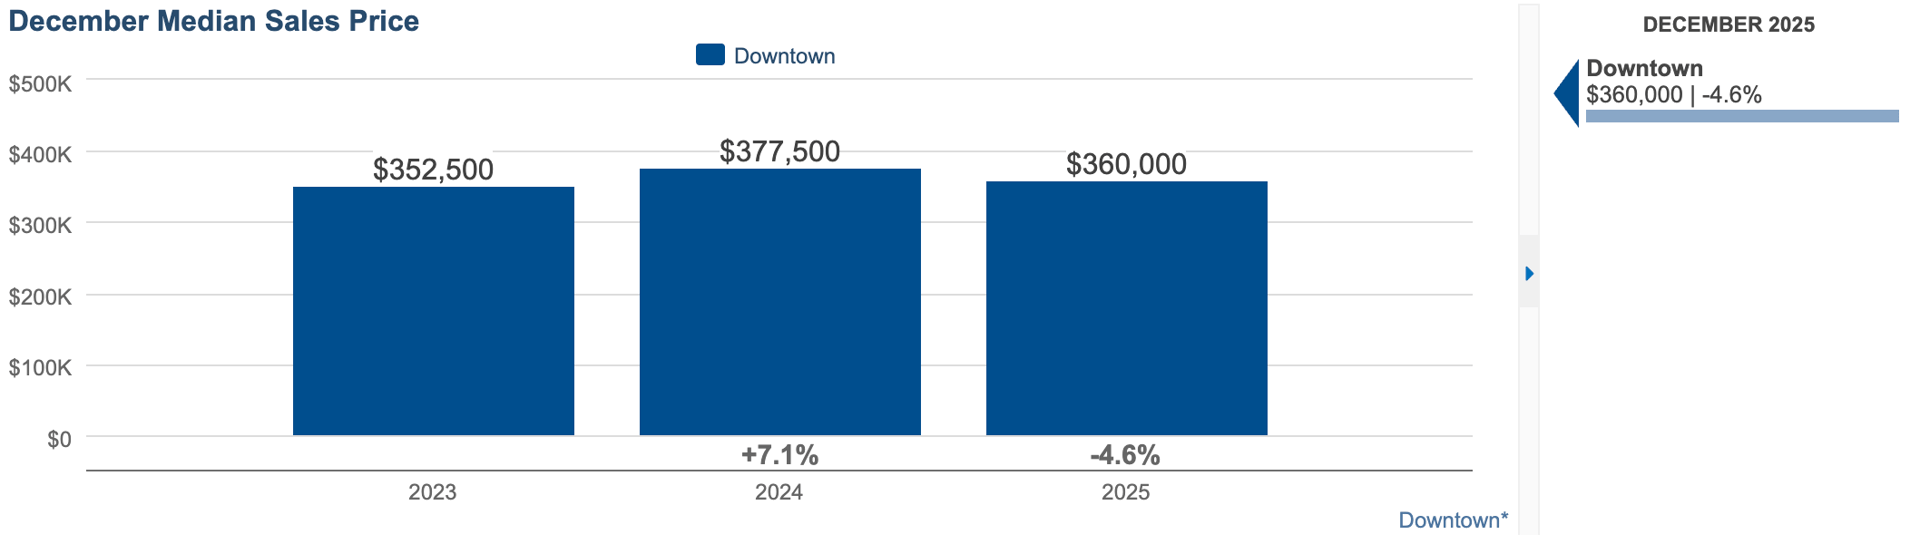
The median sales price dipped 4.6% to $360,000, down from $377,500 in 2024 and closer to 2023’s $352,500.
This adjustment reflects:
-
Buyer sensitivity to monthly payments
-
Greater inventory choice
-
Fewer bidding wars at the median level
What it means: Sellers who priced realistically sold successfully. Buyers gained entry points that felt more rational and sustainable.
Price Per Square Foot: Values Hold, Expectations Adjust
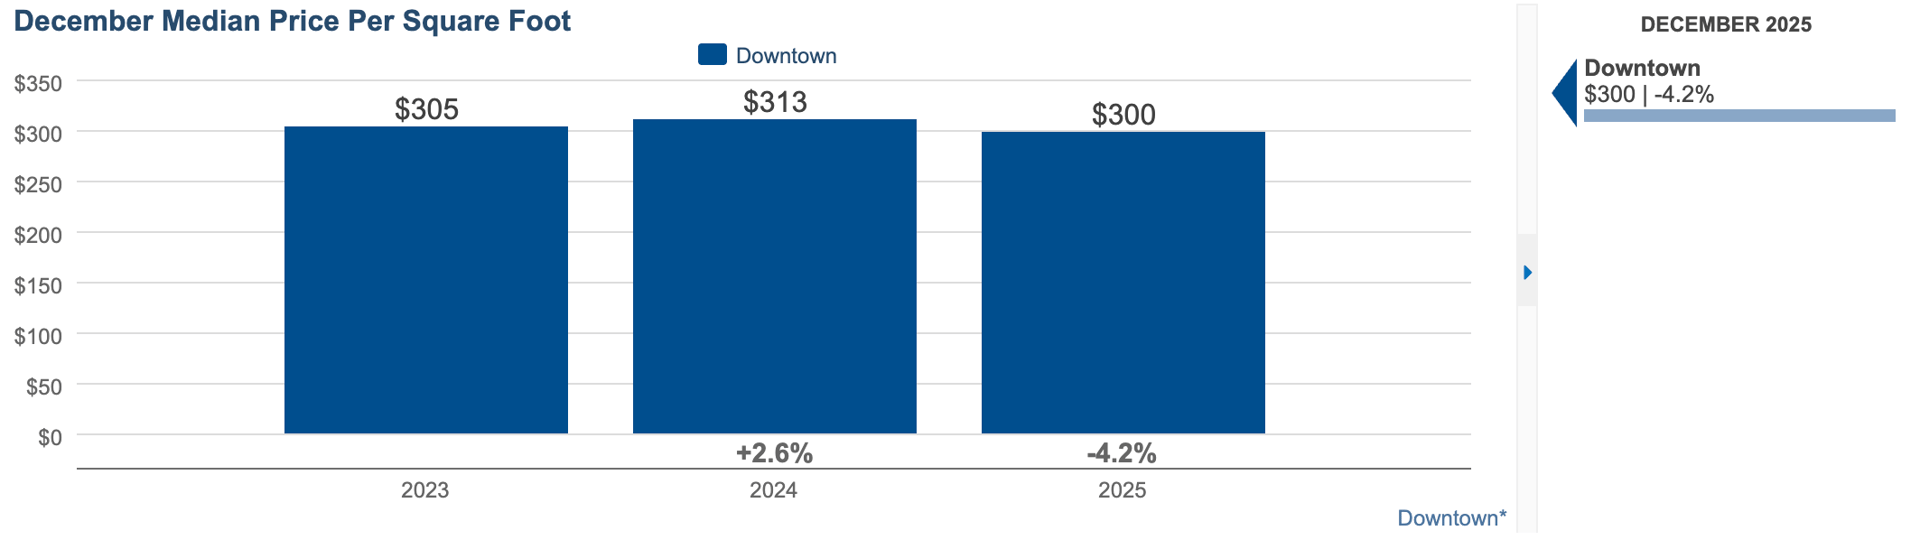
The median price per square foot declined 4.2% to $300, compared to $313 in 2024 and $305 in 2023.
This metric confirms what many downtown owners felt: values softened slightly but remained historically strong.
What it means: Quality, views, floor plan, and building reputation continued to command premiums. Generic or dated units felt the most pressure.
Final Takeaway: A Smarter, More Sophisticated Market
2025 marked a turning point for Downtown Minneapolis real estate. We moved from reactionary to intentional — from momentum-driven decisions to data-backed strategy.
For 2026, expect:
-
Buyers to stay selective but engaged
-
Sellers to succeed through precision, not optimism
-
Downtown specialists to matter more than ever
As the #1 single agent in Downtown Minneapolis this year, my role has increasingly been about interpretation and navigation — helping clients understand not just what the numbers say, but how to use them to their advantage.
If you’re planning a move in 2026 — whether buying, selling, or simply evaluating options — this is exactly the kind of market where expertise pays dividends.
Thinking about buying or selling downtown?
Let’s talk about how these trends influence your timing, strategy, and opportunities in today’s market.
📩 Contact: [email protected]
Data retrieved from the NorthStarMLS via map of Downtown Minneapolis neighborhoods including Loring Park, Elliot Park, Downtown West, Central Minneapolis, North Loop, East Town, Mill District, Nicollet Island, St. Anthony West, and Marcy-Holmes.