

Downtown Minneapolis Real Estate Market Update — February 2026
February continued the more measured pace we began to see in January, with subtle signs of stabilization beneath the surface. While overall activity remains lower than this time last year, the data reflects a market that is taking a thoughtful pause. Buyers are moving carefully, sellers are entering strategically, and well-positioned properties are still finding traction.
Comparing February 2026 to February 2025 reveals a market balancing supply, pricing, and buyer selectivity in real time. We anticipate listing activity to increase greatly in the Spring market, and feel it is an excellent time to explore the private market and be ready for the right time to list publicly.
New Listings
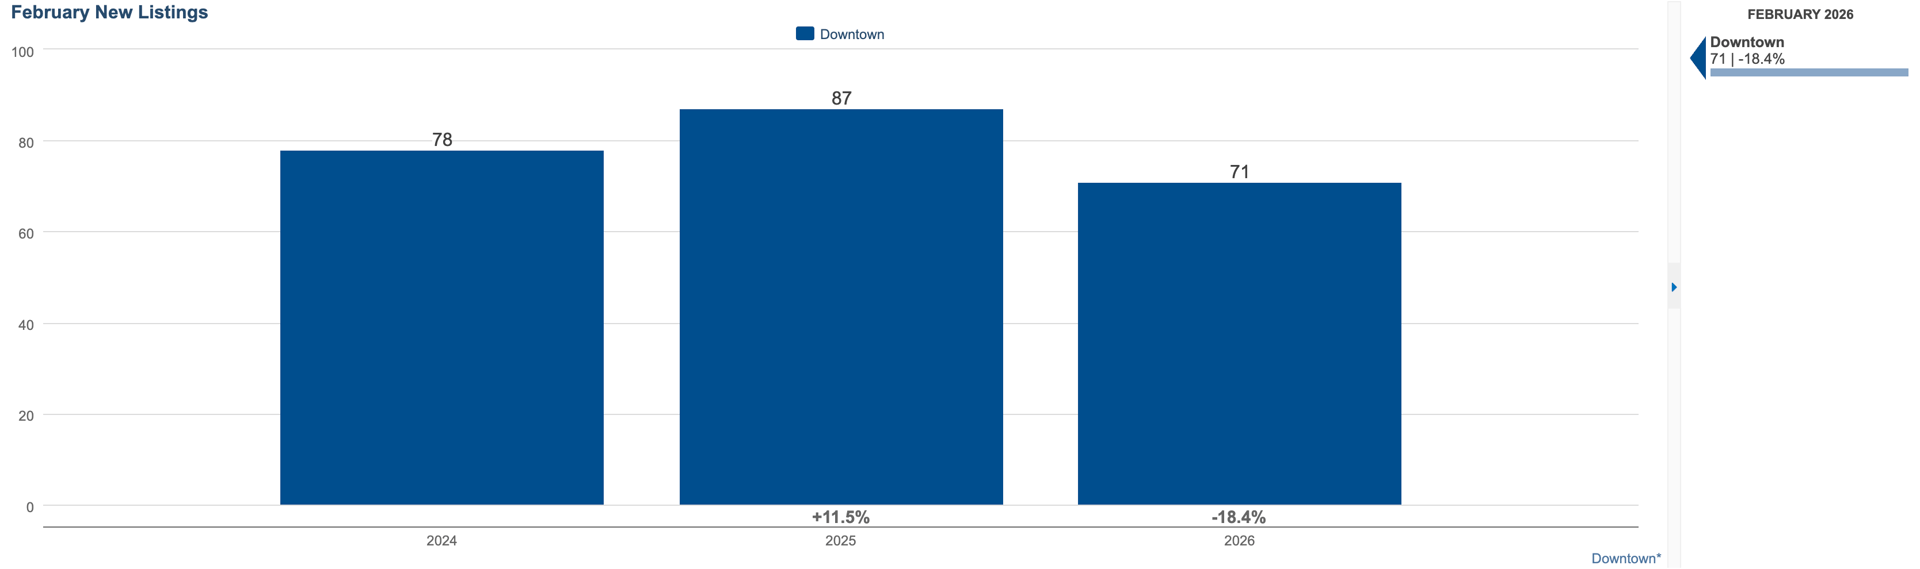
February 2026: 71 (-18.4% YoY)
New listing activity remained below last year’s levels, though slightly improved from January’s slowdown. Many sellers continue to weigh broader economic signals before entering the market, contributing to tighter inventory.
For buyers, this means fewer options — but also less competition in certain segments. For sellers, thoughtful pricing and presentation remain critical in capturing serious attention.
Closed Sales
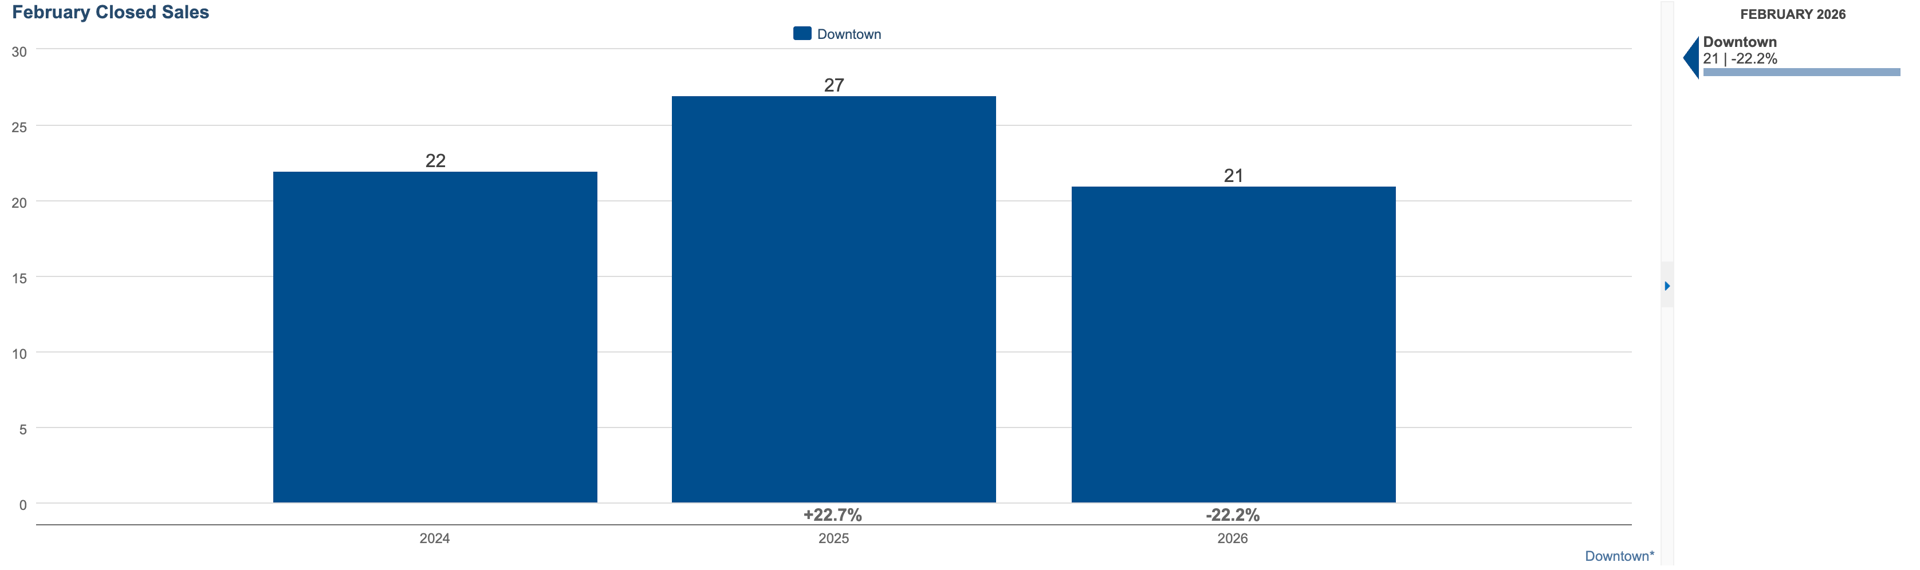
February 2026: 21 (-22.2% YoY)
Closed sales were down compared to February 2025, reflecting contracts negotiated during the winter’s more cautious climate. However, the decline is less severe than January’s year-over-year drop, suggesting the pace may be beginning to normalize.
Transaction volume is softer, but not stalled. The buyers who are active are intentional and prepared.
Median Days on Market
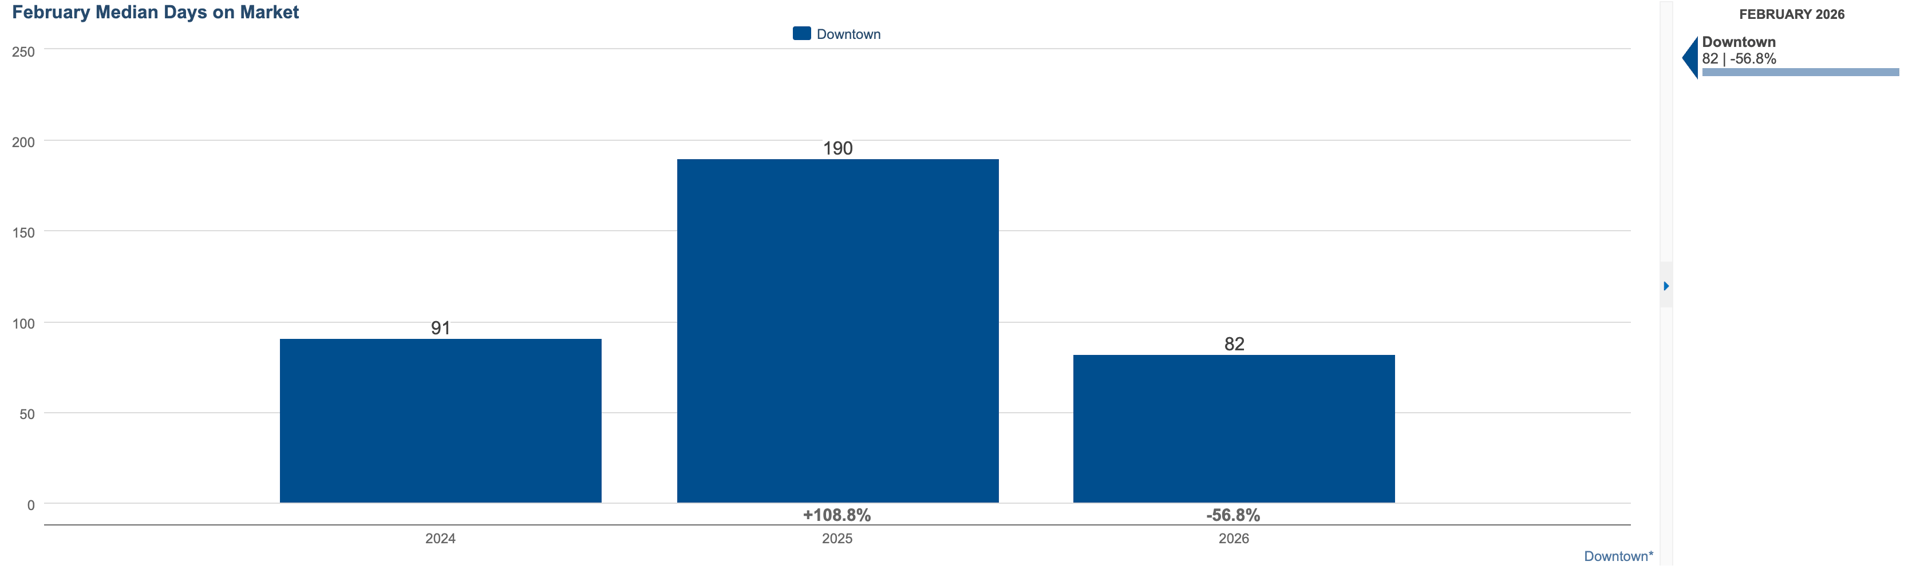
February 2026: 82 days (-56.8% YoY)
One of the most notable shifts this month is the dramatic reduction in days on market to a much more reasonable pace compared to February 2025 data. Homes that are selling are doing so far more quickly than last year, helped by the leveling off of severe winter weather.
This points to an important distinction: while fewer homes are trading overall, those that are priced appropriately and aligned with buyer expectations are moving efficiently. The market is rewarding realism.
Median Sales Price
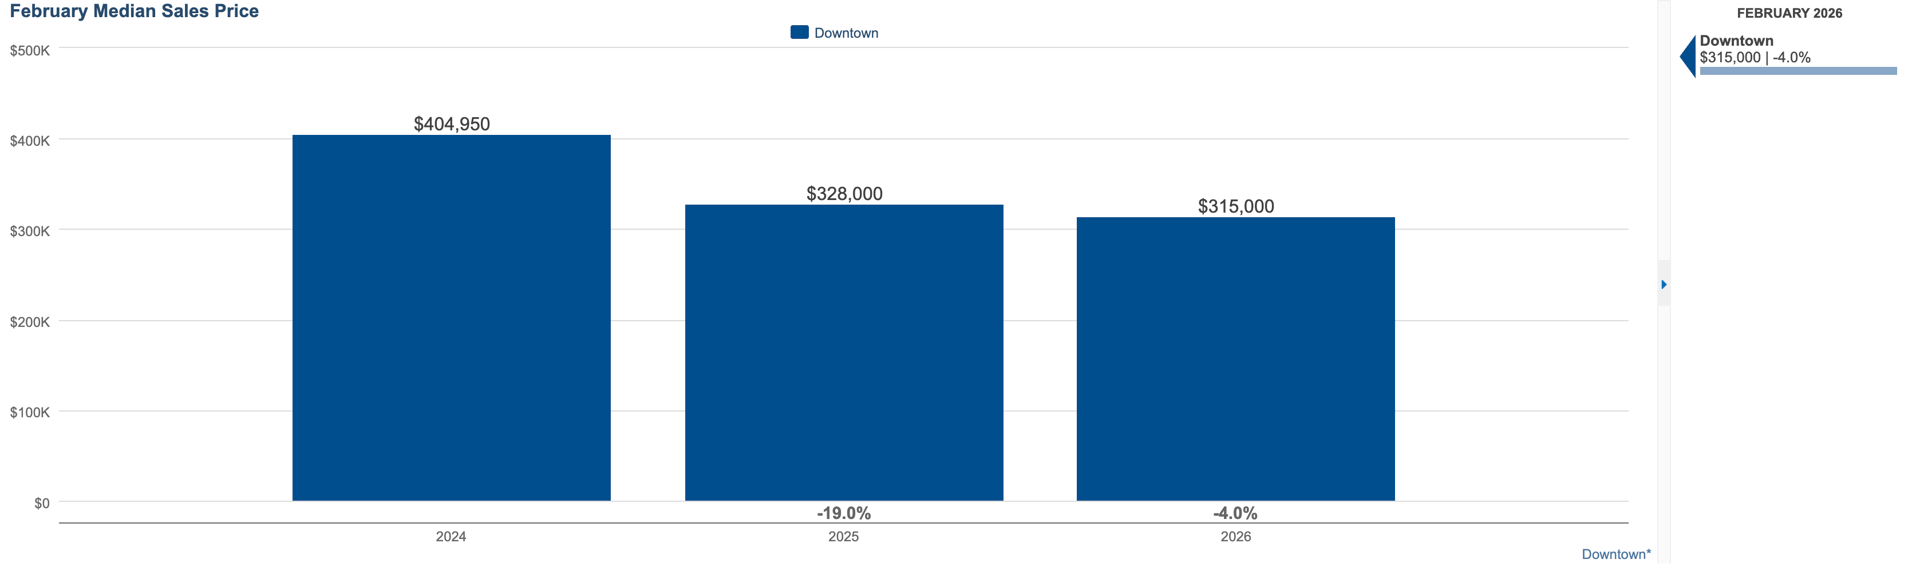
February 2026: $315,000 (-4.0% YoY)
The median sale price dipped modestly year-over-year. This shift likely reflects changes in the mix of properties selling rather than broad-based depreciation. With fewer high-end transactions closing this month, the median naturally adjusts.
Downtown pricing remains stable within well-positioned buildings and desirable locations, even as the overall number moderates.
Median Price per Square Foot
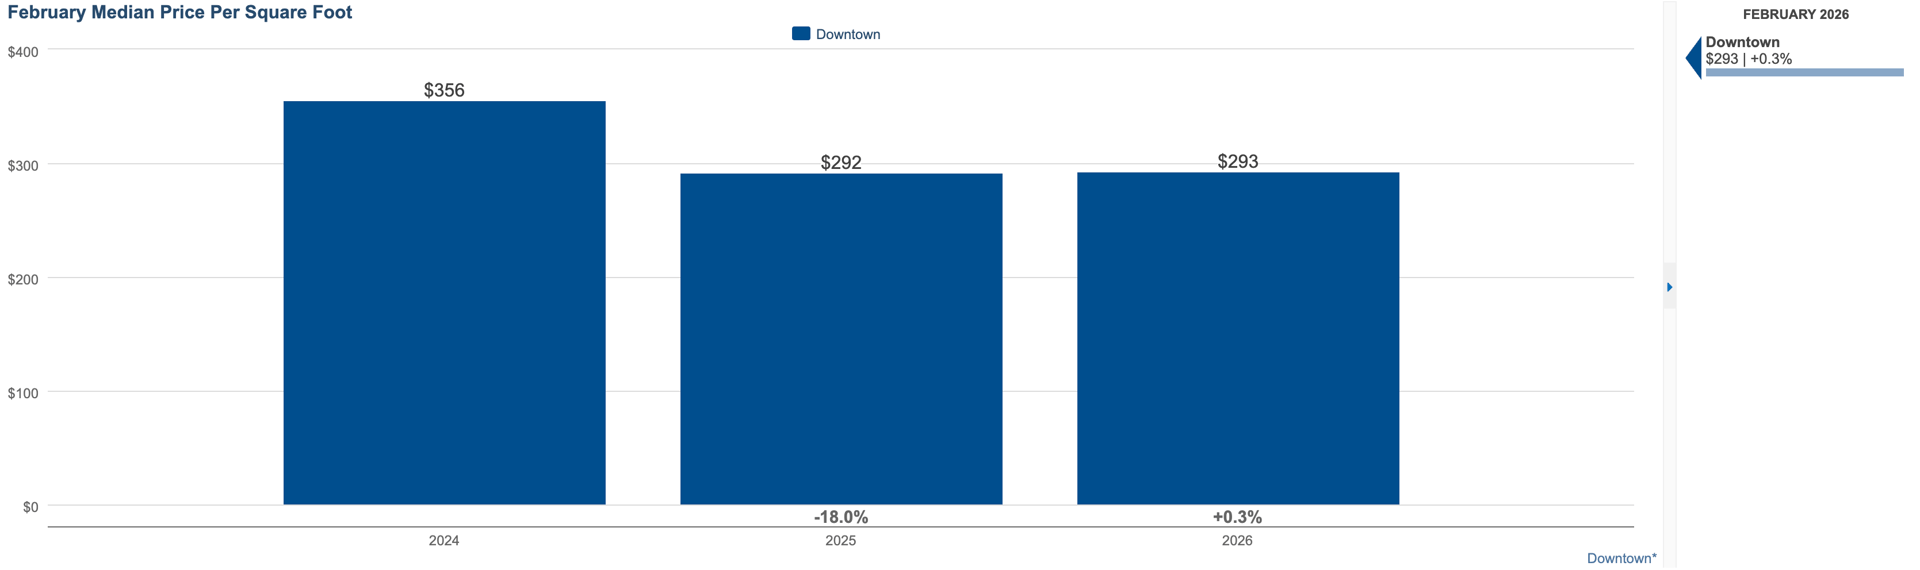
February 2026: $293 (+0.3% YoY)
Price per square foot held essentially flat compared to last year — a subtle but meaningful signal of underlying value stability.
Even with softer median sale prices, buyers continue to pay consistent rates relative to size. This suggests that demand for well-located downtown property remains intact, and even boosted particularly for updated or well-designed units.
The Broader Picture
February’s numbers reinforce a theme we are seeing early in 2026: lower volume, faster absorption for strong listings, and pricing that is largely stabilizing beneath the surface. It is not a market of urgency — it is a market of intention as we move into the busy season.
Downtown Minneapolis continues to attract buyers who value walkability, architecture, cultural access, and lifestyle convenience. In times of broader uncertainty, real estate often becomes more strategic. Those who move forward are doing so thoughtfully — and with long-term perspective.
For sellers, preparation and pricing precision are key. For buyers, this winters' environment has offered opportunity without the intensity, but also with relatively limited inventory.
REACH OUT TO DISCUSS HOW THESE NUMBERS AFFECT YOUR MARKET TIMING
📧 [email protected]
Data retrieved from the NorthStarMLS via map of Downtown Minneapolis neighborhoods including: Loring Park, Elliot Park, Downtown West, Central Minneapolis, North Loop, East Town, Mill District, Nicollet Island, St. Anthony West, and Marcy-Holmes.