

Downtown Minneapolis Real Estate Market Update: February 2025 vs. February 2024
Our team has experienced record wins so far in 2025 - we see our individual data outpacing the market time and time again, so keep this in mind when you choose to work with us. Who you work with truly matters more than when you choose to list or buy...
The downtown Minneapolis real estate market saw a shift in pricing, creating both challenges and opportunities for buyers and sellers. Here’s a breakdown of the latest trends and key takeaways for February 2025 compared to February 2024.
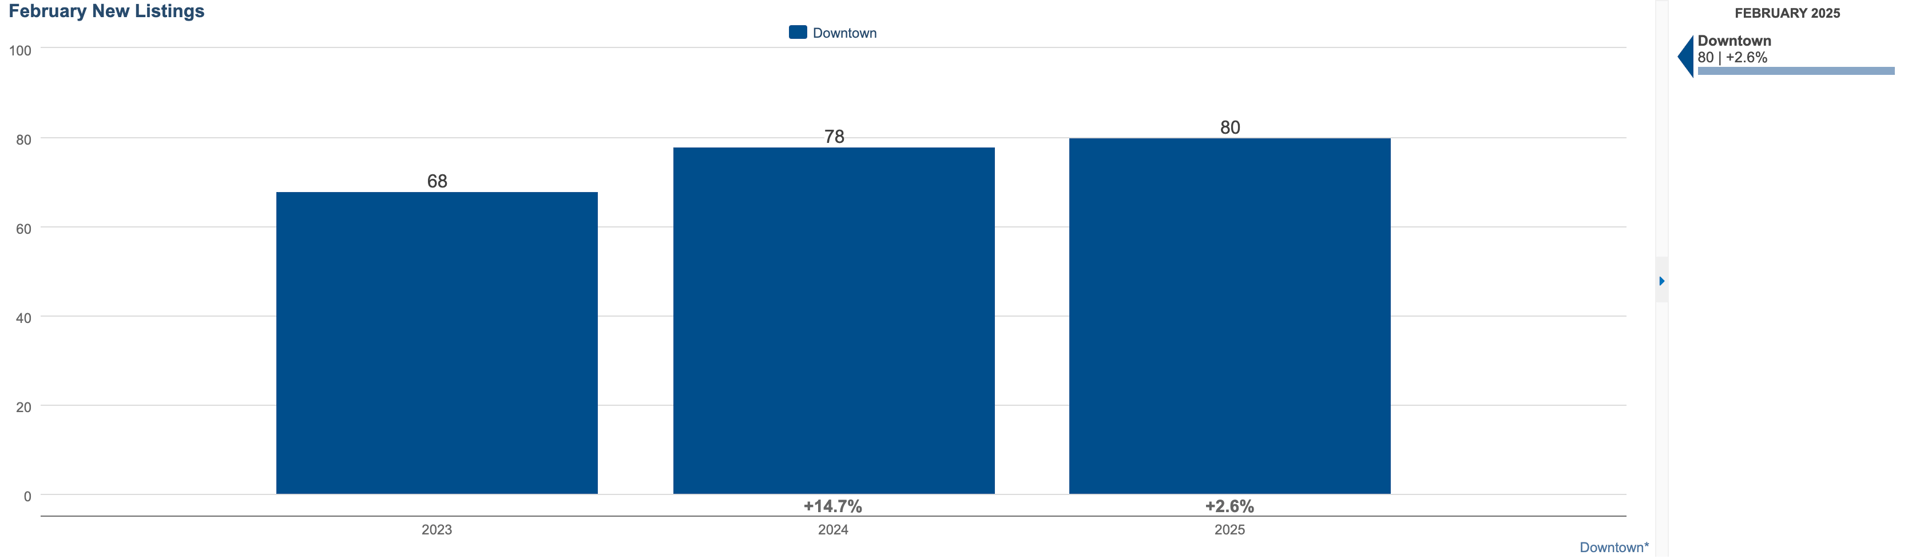
1. New Listings: 80 (+2.6%)
📌 More options, but still limited inventory
While new listings saw a slight increase, the growth remains modest. This suggests that while sellers are still entering the market, inventory levels aren't surging, which helps prevent a major oversupply. Buyers have a few more choices, but competition remains in select price points.
2. Median Sale Price: $320,000 (-21%)
📌 Lower priced listings made up a majority of the market
A 21% drop in the median sale price signals a major shift in the range of properties for sale — good news for buyers looking to enter the downtown market at a lower price point with many available options. However, sellers need to realign expectations and ensure pricing is competitive in these price ranges.
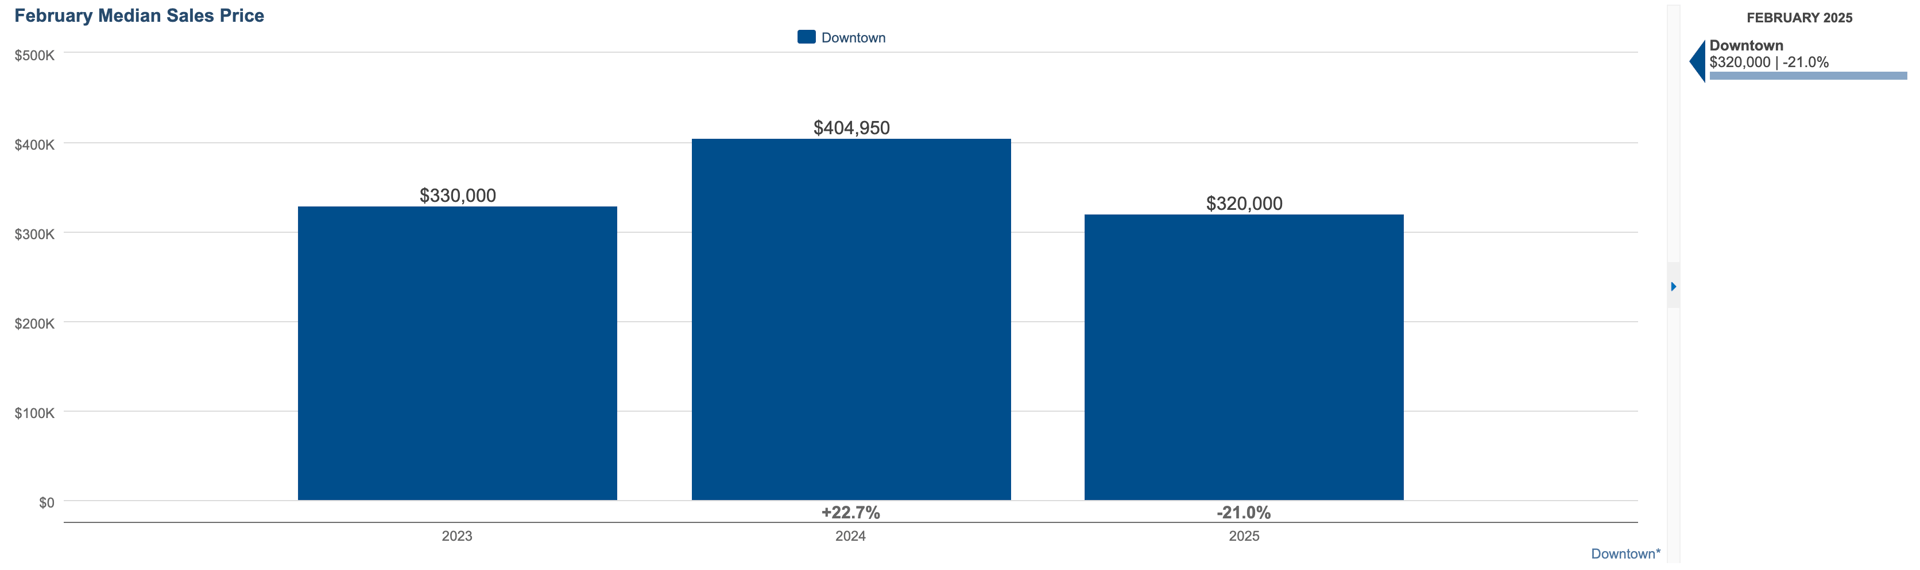
Luxury condos and high-end properties operated outside of this range, yet there wasn't significant movement in February.
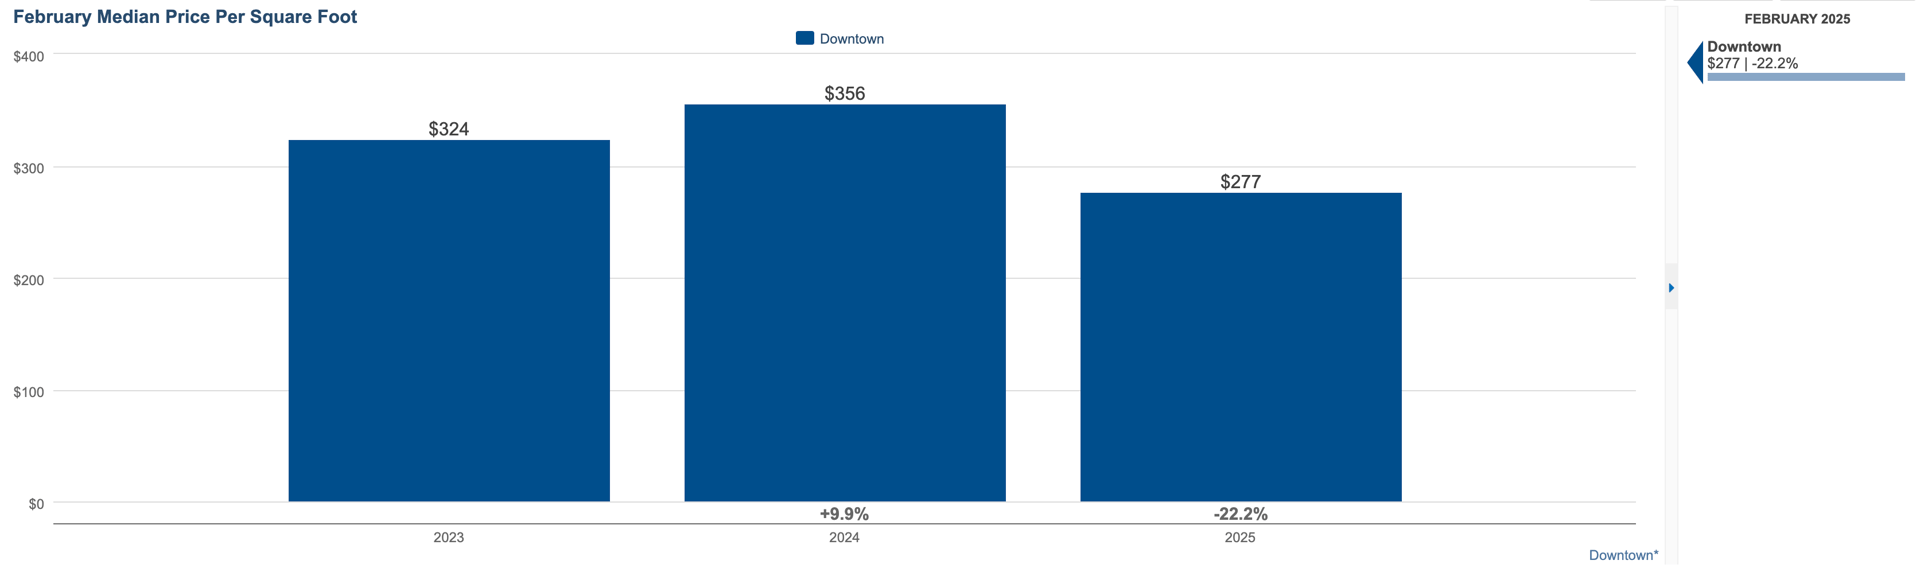
3. Price per Square Foot: $277 (-22.2%)
📌 In-step with the lower median sales price compared to last year, no extraordinary shift
With price per square foot also down, buyers are finding 'better' value per dollar spent. This is to be expected with the lower overall median sales price.
4. Days on Market: 194 Days (+113.2%)
📌 Patience and strategic pricing are key
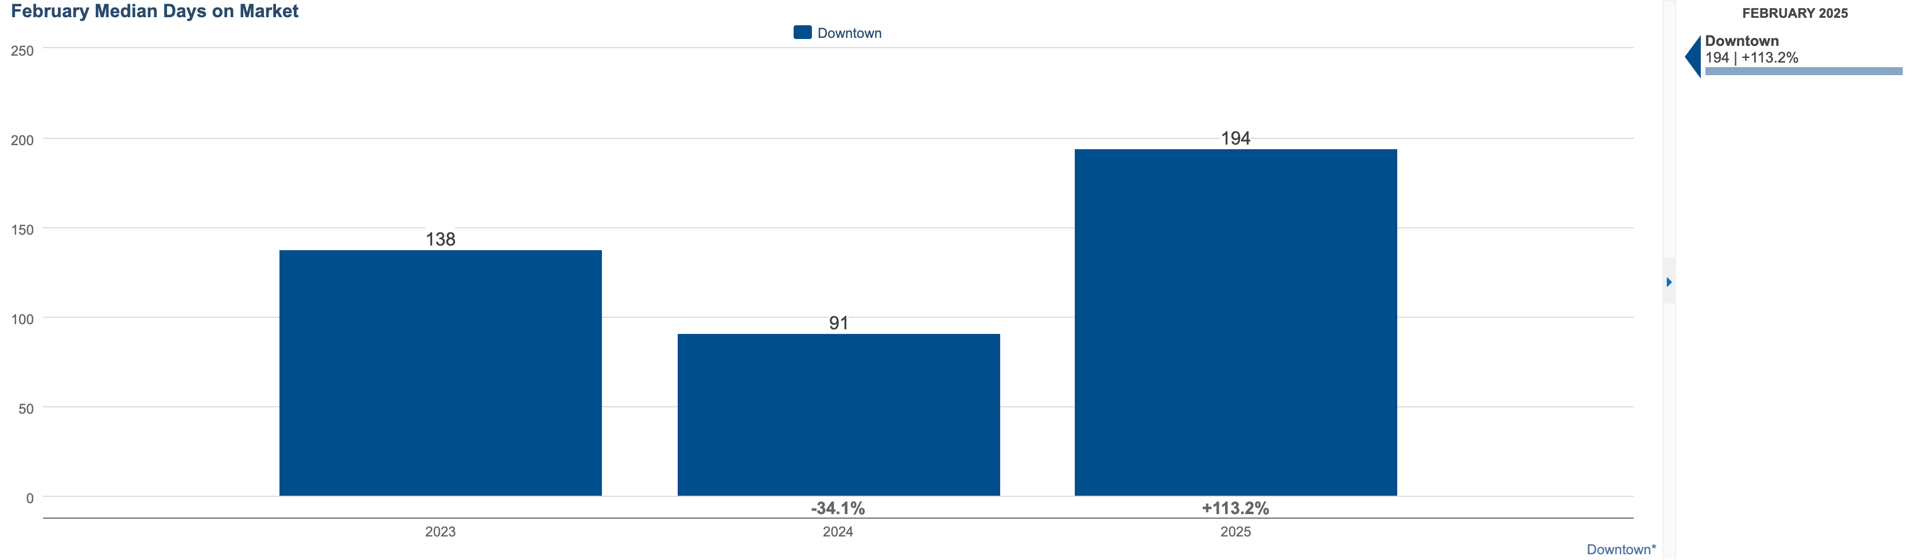
Homes in February may have sat over six months on average, more than double the time from last year. This extended selling timeline means pricing and presentation are more important than ever. Sellers who price aggressively and stage effectively will have a much better chance of attracting serious buyers.
5. Closed Sales: 23 (+4.5%)
📌 Transactions are still happening, despite market shifts
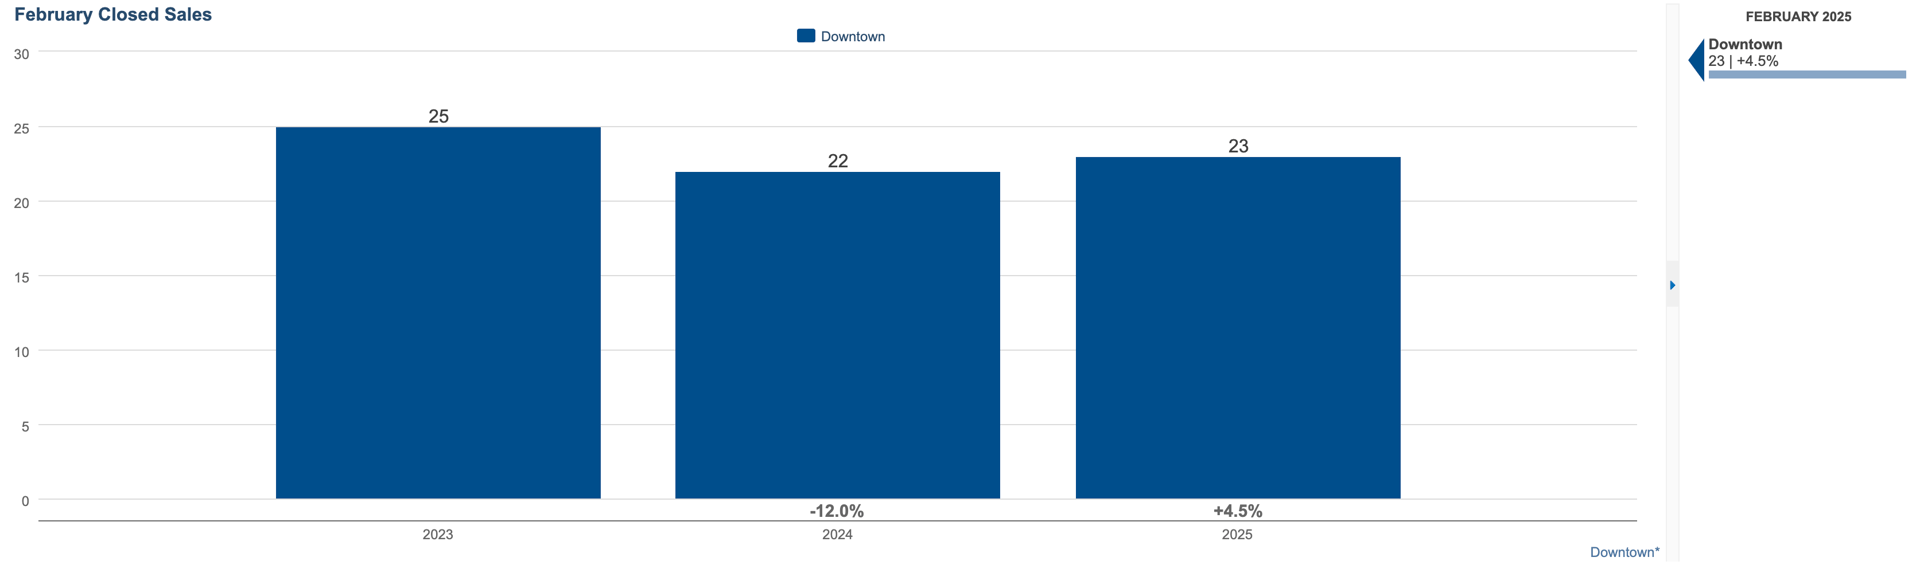
While home prices were lower than the norm and days on market have increased, sales have ticked up slightly. This suggests that committed buyers are still in the market — likely those taking advantage of the less costly inventory.
If you’re thinking about buying or selling in downtown Minneapolis, let’s chat about the best strategy for today’s market!
REACH OUT TO DISCUSS HOW THESE NUMBERS AFFECT YOUR MARKET TIMING AT [email protected]
Data retrieved from the NorthStarMLS via map of Downtown Minneapolis Neighborhoods including: Loring Park, Elliot Park, Downtown West, Central Minneapolis, North Loop, East Town, Mill District, Nicollet Island, St. Anthony West, and Marcy-Holmes.
HAVE QUESTIONS ABOUT DOWNTOWN MINNEAPOLIS OR SURROUNDING REAL ESTATE MARKETS?
Contact our team by call, email, or submitting a form at: https://lynnburnrealestate.com/