
As always, reach out to discuss how these numbers affect your market timing at [email protected]
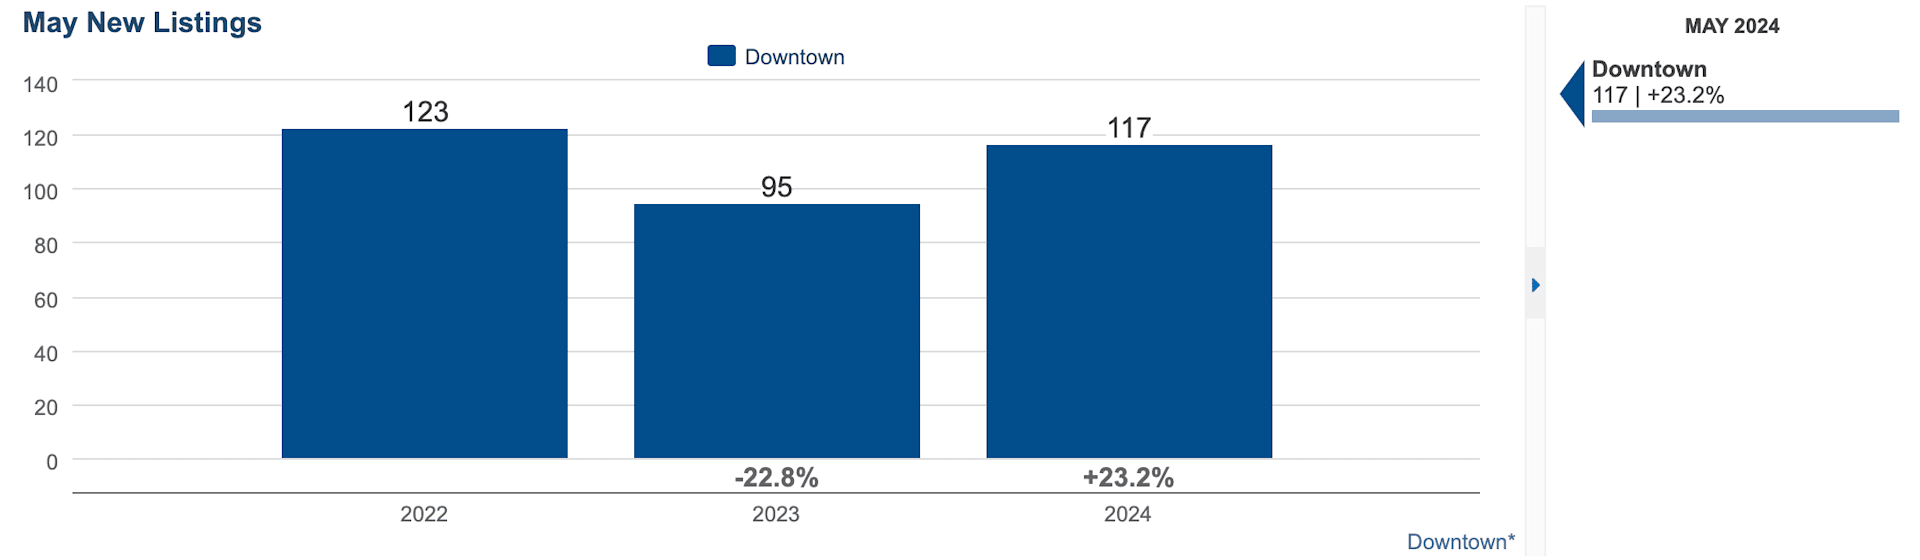
Increase in New Listings
The downtown Minneapolis real estate market saw a significant rise in new listings, increasing by over 23% from May 2023 to May 2024. This suggests a more active market with more homeowners deciding to sell their properties. The influx of inventory could be driven by various factors such as homeowners looking to capitalize on current prices or responding to increased demand.
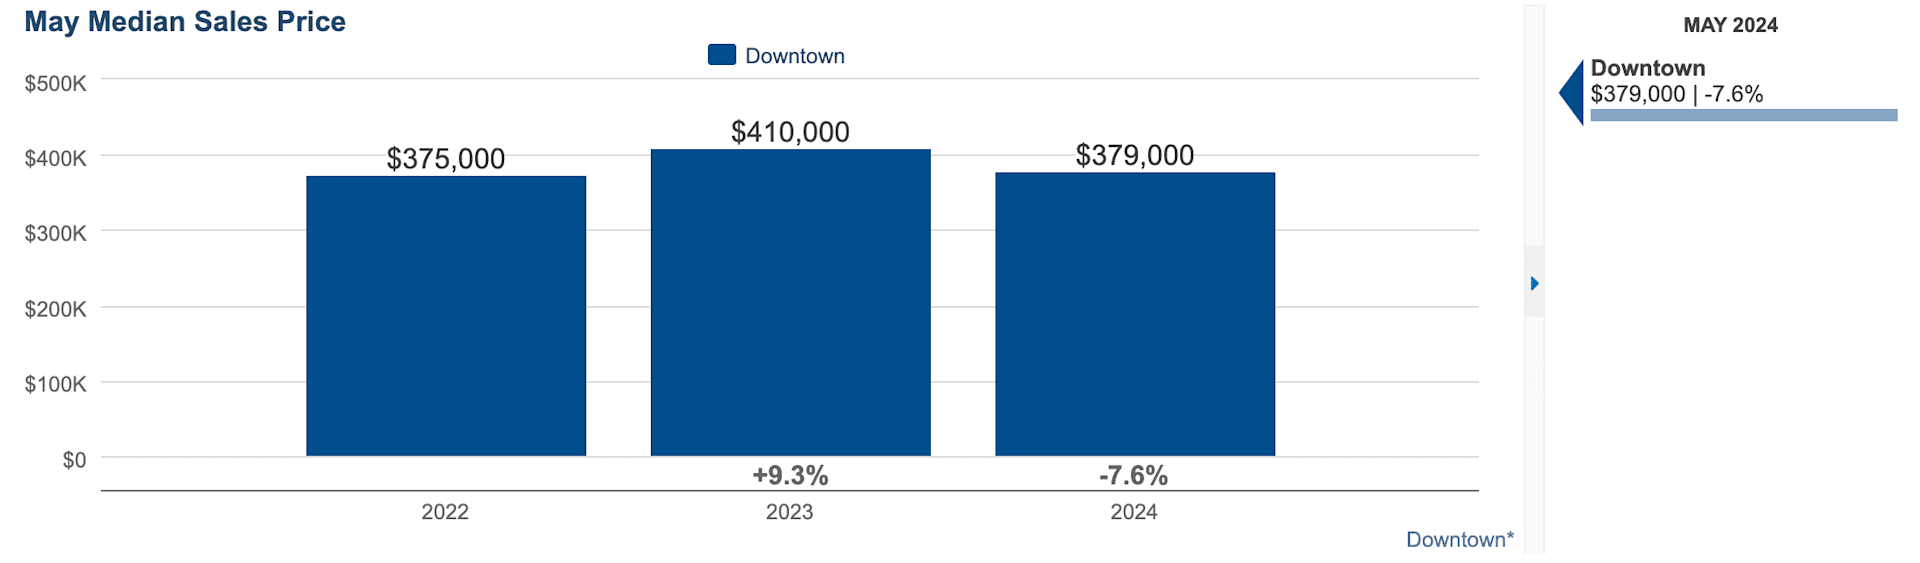
Decrease in Median Sales Price
The median sales price decreased slightly to $379,000, a dip of about 7%. Various economic factors, including interest rates, buyer affordability, or market saturation, could contribute to this decline. Sellers may need to adjust their marketing strategies to remain competitive in this changing market landscape - but with an excellent agent, they will already have this in mind.
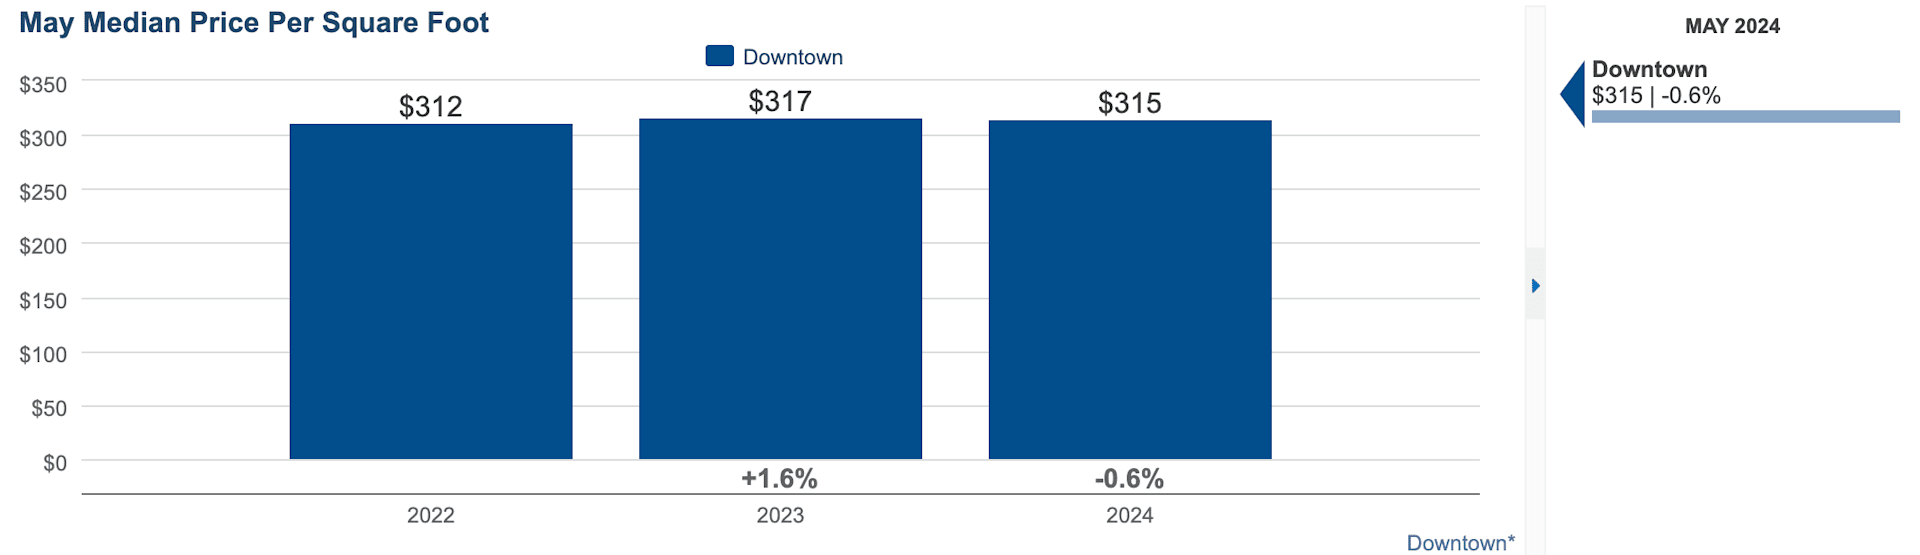
Steady Median Price per Square Foot
Despite the overall slight dip in median sales prices, the median price per square foot remained relatively stable, decreasing only by 0.6% to $315/sq ft. This stability suggests that the value of properties in terms of their size has not significantly depreciated, indicating steady demand for space. Buyers focusing on long-term investment value might find this aspect particularly attractive.
Reduction in Median Days on Market
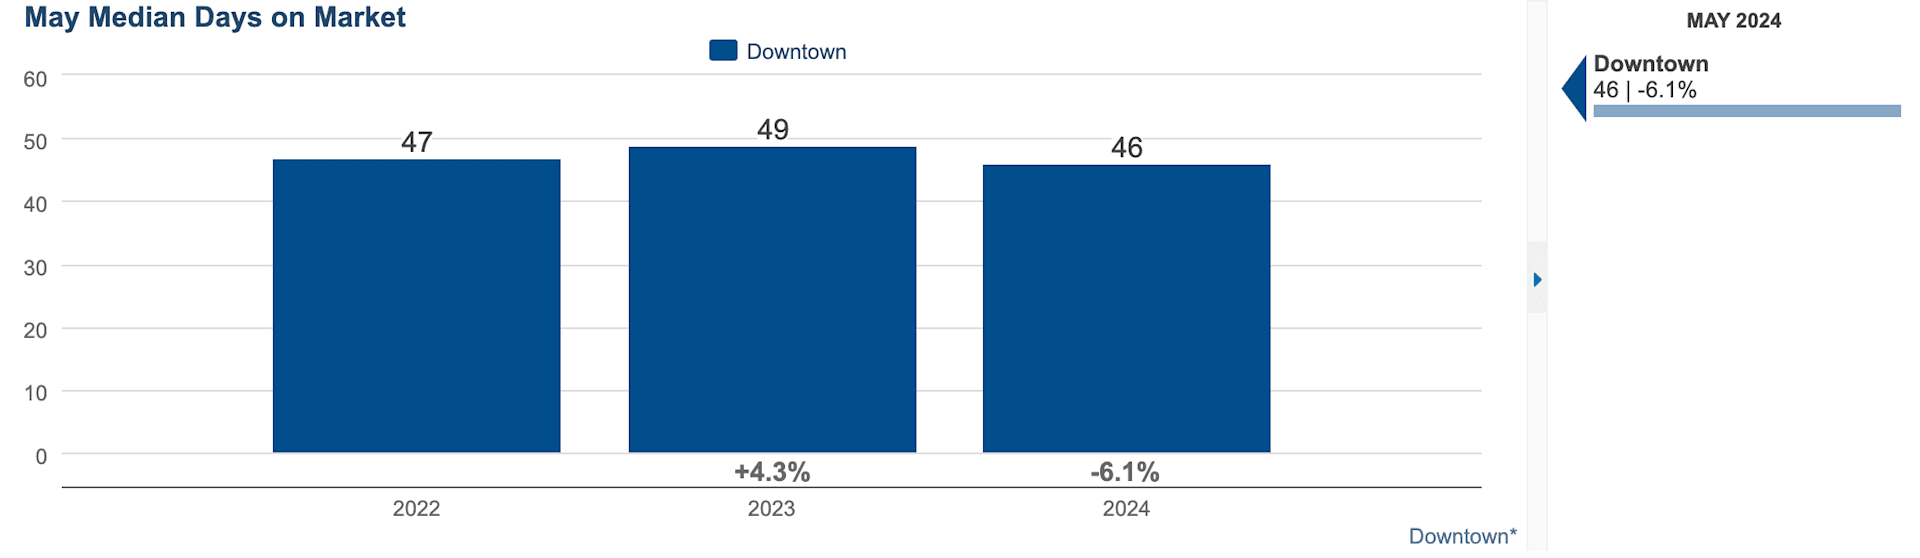
The median days on market went down by about 6%, meaning homes are selling more quickly. This is a positive indicator of buyer activity and market health! Faster sales can boost buyer confidence and reduce holding costs for sellers, encouraging more listings.
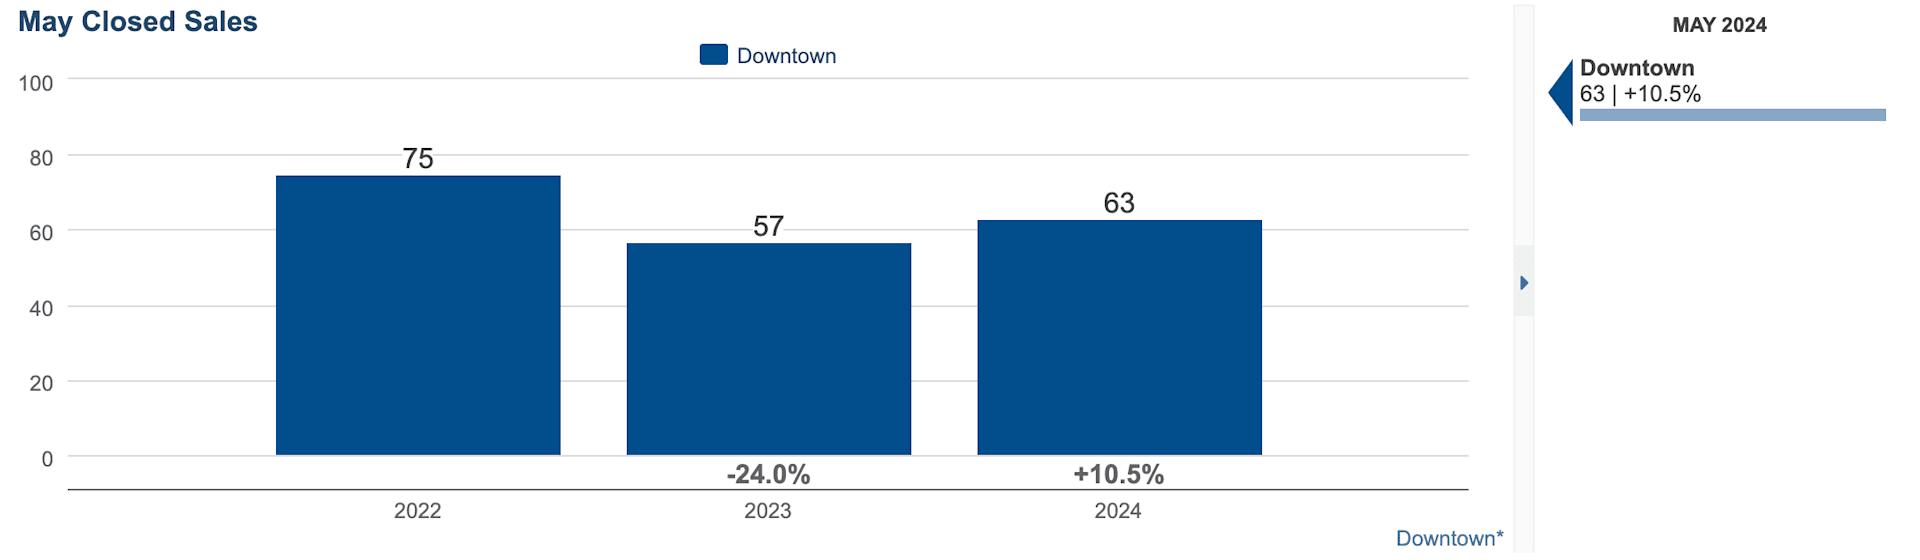
Increase in Closed Sales: The number of closed sales rose to 63, up 10.5% over the previous May. This reflects strong buyer interest and successful transactions, signaling a robust market despite the slight dip in median sales prices. The continued demand absorbing the increased supply of listings underscores a resilient market environment.
The combination of increased listings, quicker sales, and a stable price per square foot suggests a dynamic and resilient downtown Minneapolis real estate market, crucial for sustained growth and stability.
Data retrieved from the NorthStarMLS via map of Downtown Minneapolis Neighborhoods including: Loring Park, Elliot Park, Downtown West, Central Minneapolis, North Loop, East Town, Mill District, Nicollet Island, St. Anthony West, and Marcy-Holmes.
DO YOU HAVE QUESTIONS ABOUT DOWNTOWN MINNEAPOLIS OR SURROUNDING REAL ESTATE MARKETS?
Contact our team by call, email, or submitting a form at: https://lynnburnrealestate.com/