

The Downtown Minneapolis market continued its steady recalibration in November, reflecting a blend of seasonal slowing, shifting buyer behavior, and a more stable price environment. Comparing November 2025 to the same time last year highlights how inventory, timing, and demand are interacting as we head into winter and prepare for the season ahead.
New Listings
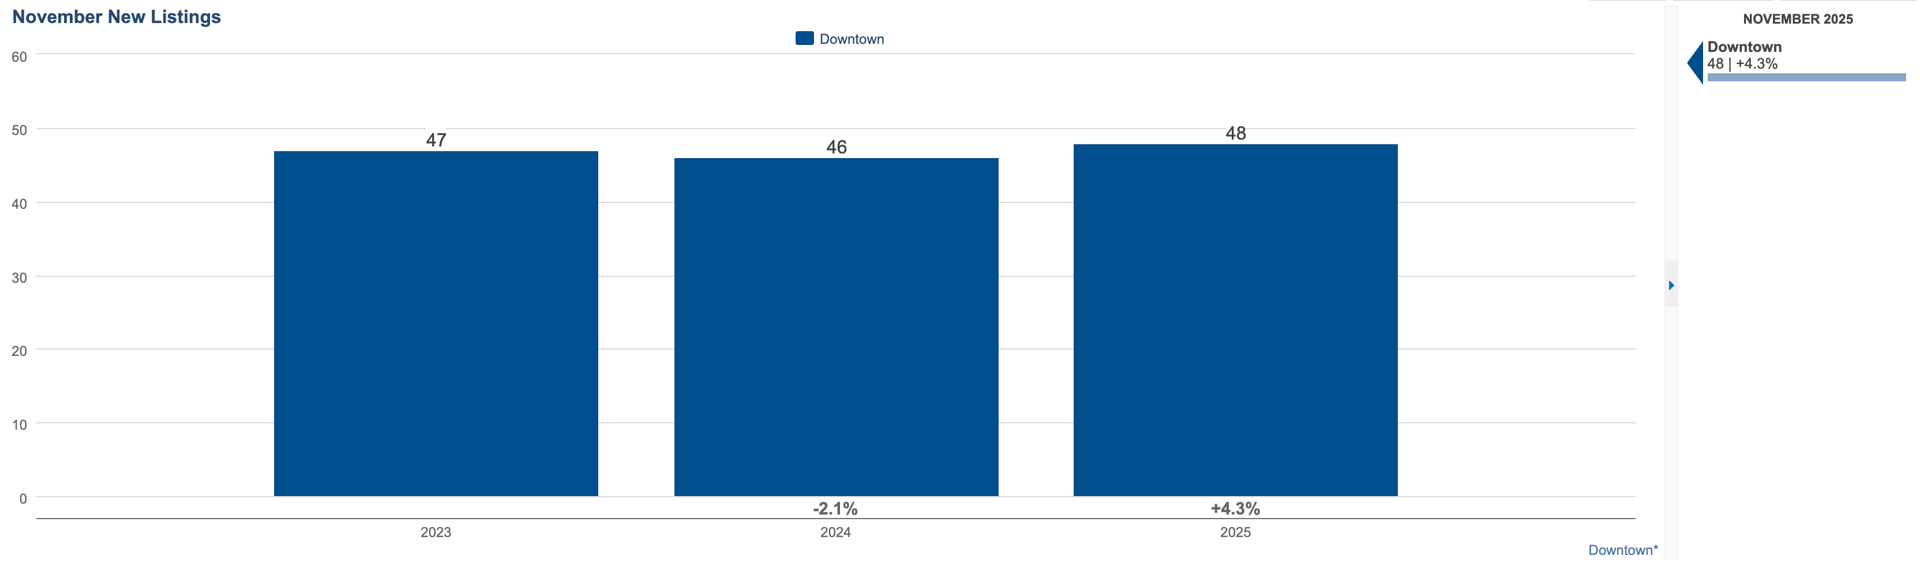
November 2025: 48 (+4.3% YoY)
New listing activity saw a slight uptick this November, with slightly more sellers opting to bring their homes to market compared to last year. This increase, while modest, reinforces the trend we’ve seen throughout 2025: steady, consistent inventory growth rather than abrupt spikes.
Sellers appear more confident entering the market, especially late in the year. Downtown buyers now have options to consider, and this added variety helps keep activity moving through the slower winter months.
Closed Sales
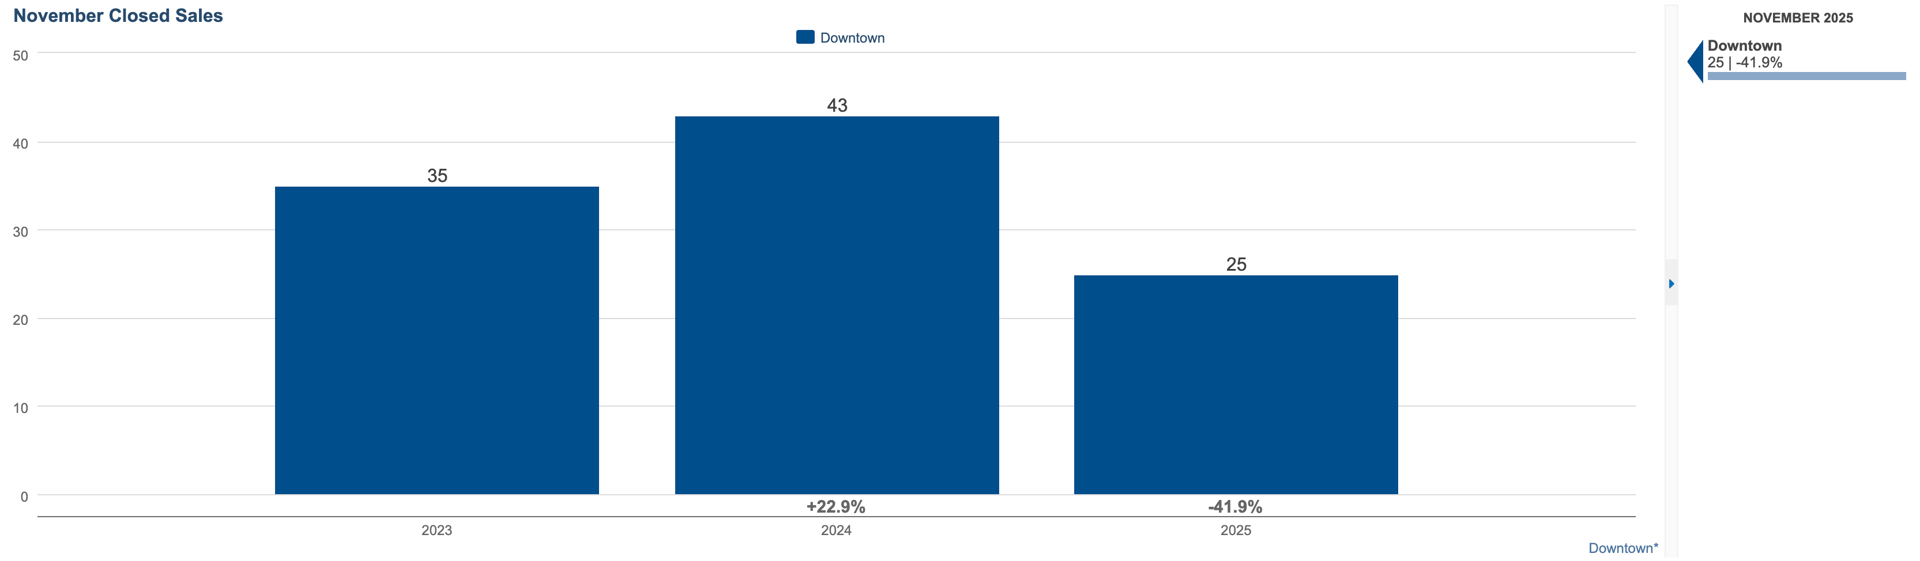
November 2025: 25 (-41.9% YoY)
Closed sales fell sharply compared to last November, reflecting a notable slowdown. While a general slowdown is partly seasonal — November is traditionally one of the quieter months downtown — it also signals the ongoing shift toward more selective, pace-controlled buyer behavior.
While demand hasn’t disappeared, buyers are taking time to evaluate options, compare buildings, and negotiate strategically. High-quality listings are still selling, but the path from showing to closing has stretched compared to previous years.
Median Days on Market
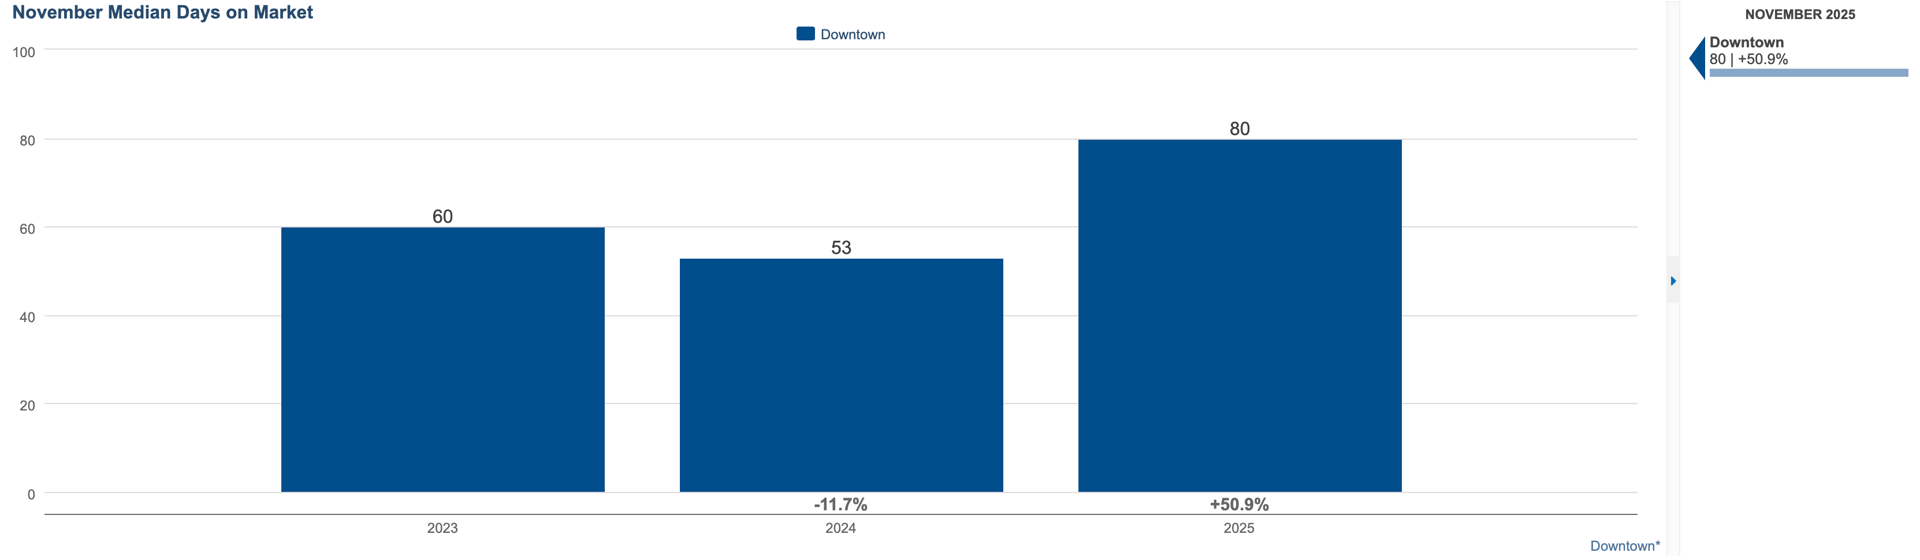
November 2025: 80 days (+50.9% YoY)
Building on the above point, homes did take significantly longer to sell this month, with the median days on market jumping to 80 days. This extended timeline aligns with the broader trend seen throughout the fall: buyers remain engaged, but they are patient, detail-focused, and more willing to wait for the right fit.
For sellers, this means preparation and pricing accuracy matter more than ever. For buyers, it creates an opportunity to explore a wider range of homes without the pressure of rapid competition.
Median Sales Price
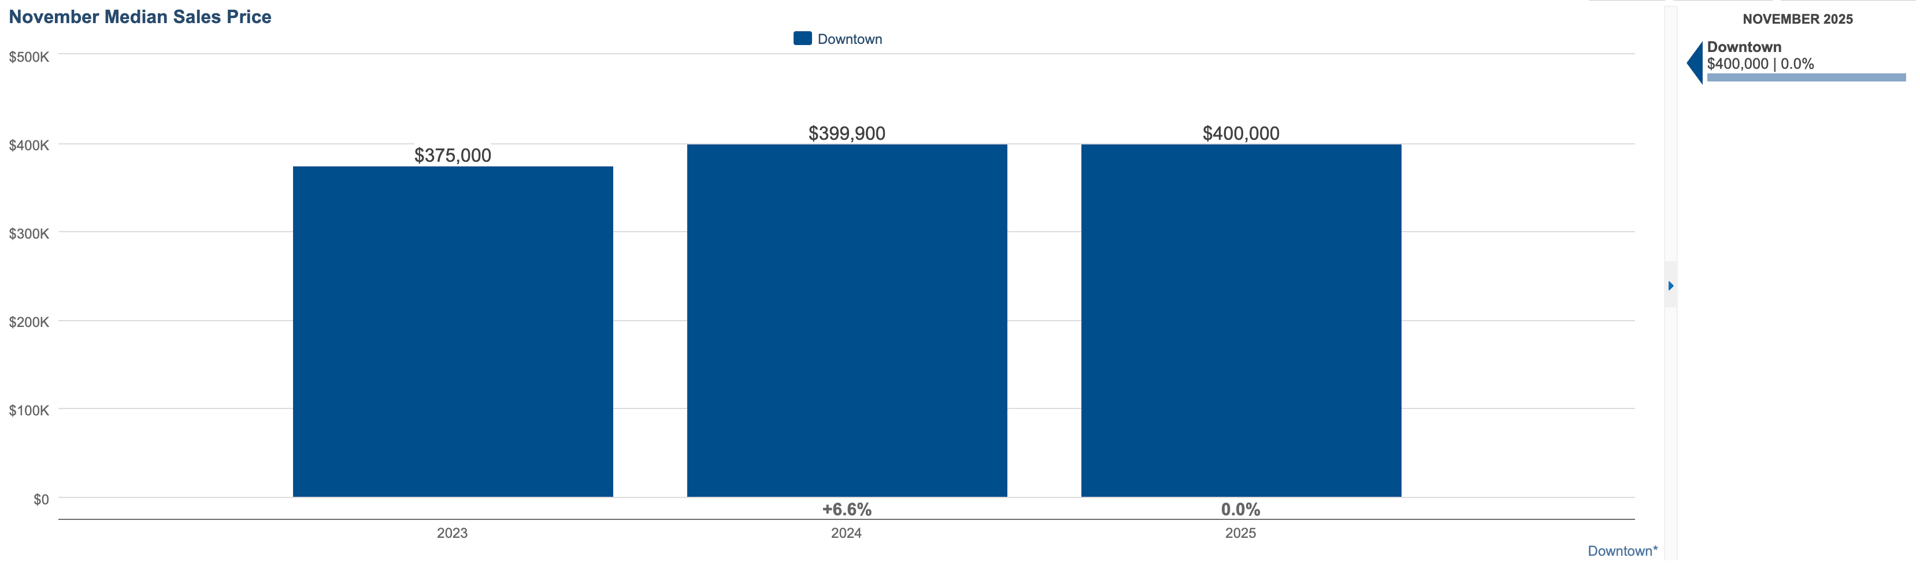
November 2025: $400,000 (0.0% YoY)
Pricing held steady year-over-year, a positive indicator that the market is stabilizing. Even with longer selling timelines and fewer closings, values are holding firm. This suggests that although the pace has slowed, buyer confidence remains, and the market has avoided the volatility seen in previous years.
The lack of price movement also reflects a more balanced mix of listings compared to last year's cluster of higher-end activity.
Median Price per Square Foot
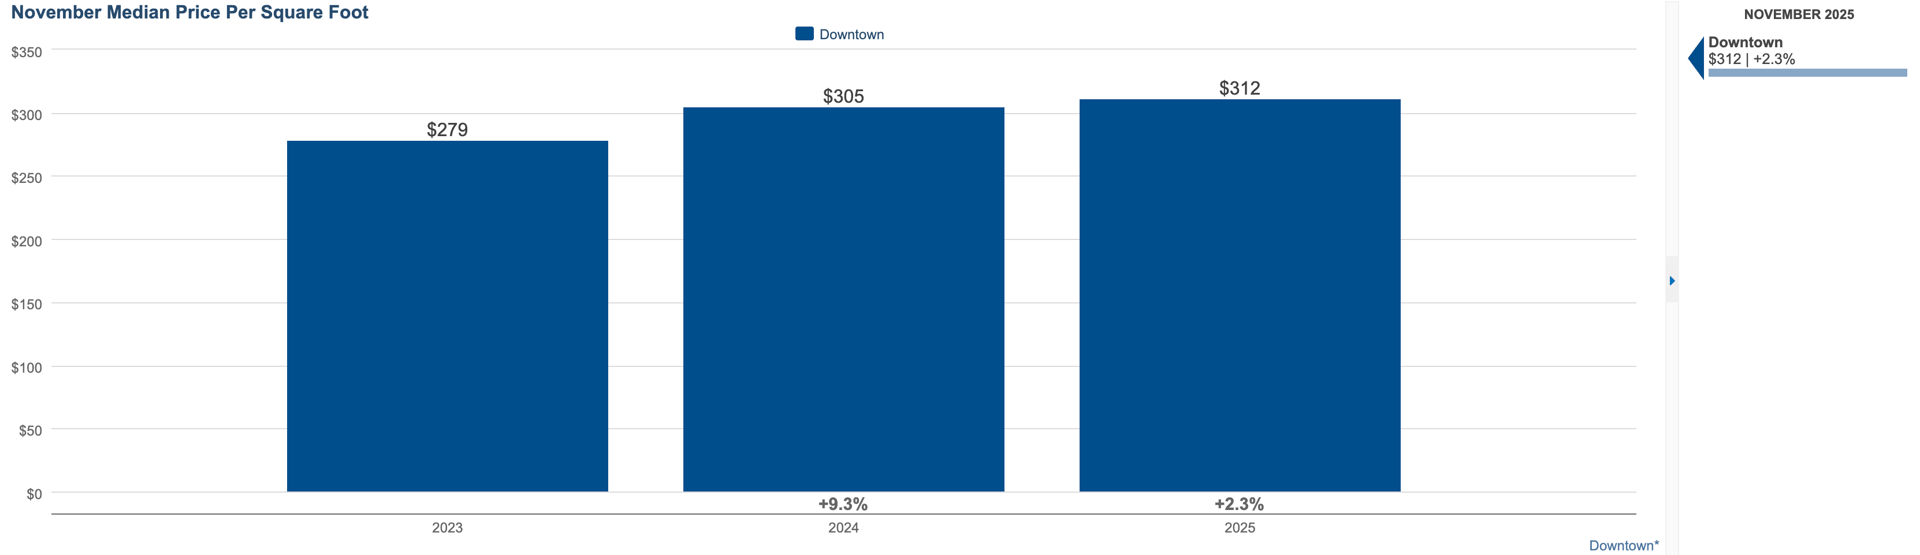
November 2025: $312 (+2.3% YoY)
Price per square foot saw a small but meaningful increase, indicating that buyers are still willing to pay for quality space, modern finishes, and desirable buildings. This trend suggests that while overall pricing is steady, well-maintained and well-presented listings continue to earn a premium.
Months Supply of Homes
November 2025: 4.8 months (-7.7% YoY)
Months supply declined slightly, landing below the 5–6 month range that typically defines a balanced market. This dip reflects steadier absorption than the closed sales number alone might suggest. Even with fewer November closings, inventory is being drawn down consistently enough to keep supply tight heading into winter.
This lower supply counterbalances longer days on market, helping keep pricing stable and preventing the market from tilting into buyer-dominant territory.
The Broader Picture
November marks yet another month of steady recalibration for the downtown Minneapolis market. Inventory remains healthy, buyer activity is thoughtful and deliberate, and pricing has settled into a stable range that benefits both sides of the transaction.
Even with fewer closings this month, the balance between supply and demand remains intact. Sellers who approach the market with strategic pricing and strong presentation continue to find success, while buyers benefit from more options and balanced competition.
As we head into the holiday season and prepare for 2026, downtown Minneapolis is positioned for a measured — and encouraging — start to the new year. Stability is returning and confidence is rising.
Thinking about buying or selling downtown?
Let’s talk about how these trends influence your timing, strategy, and opportunities in today’s market.
📩 Contact: [email protected]
Data retrieved from the NorthStarMLS via map of Downtown Minneapolis neighborhoods including Loring Park, Elliot Park, Downtown West, Central Minneapolis, North Loop, East Town, Mill District, Nicollet Island, St. Anthony West, and Marcy-Holmes.