

Downtown Minneapolis Real Estate Market Update — October 2025
The Downtown Minneapolis real estate market continues to evolve as we move deeper into fall, showing a mix of renewed seller activity, selective buyer behavior, and steady pricing. Comparing October 2025 to the same period last year — and looking at the broader year-to-date (YTD) trends — reveals a market that appears to be stabilizing after several years of shifts in inventory, pricing, and demand.
New Listings
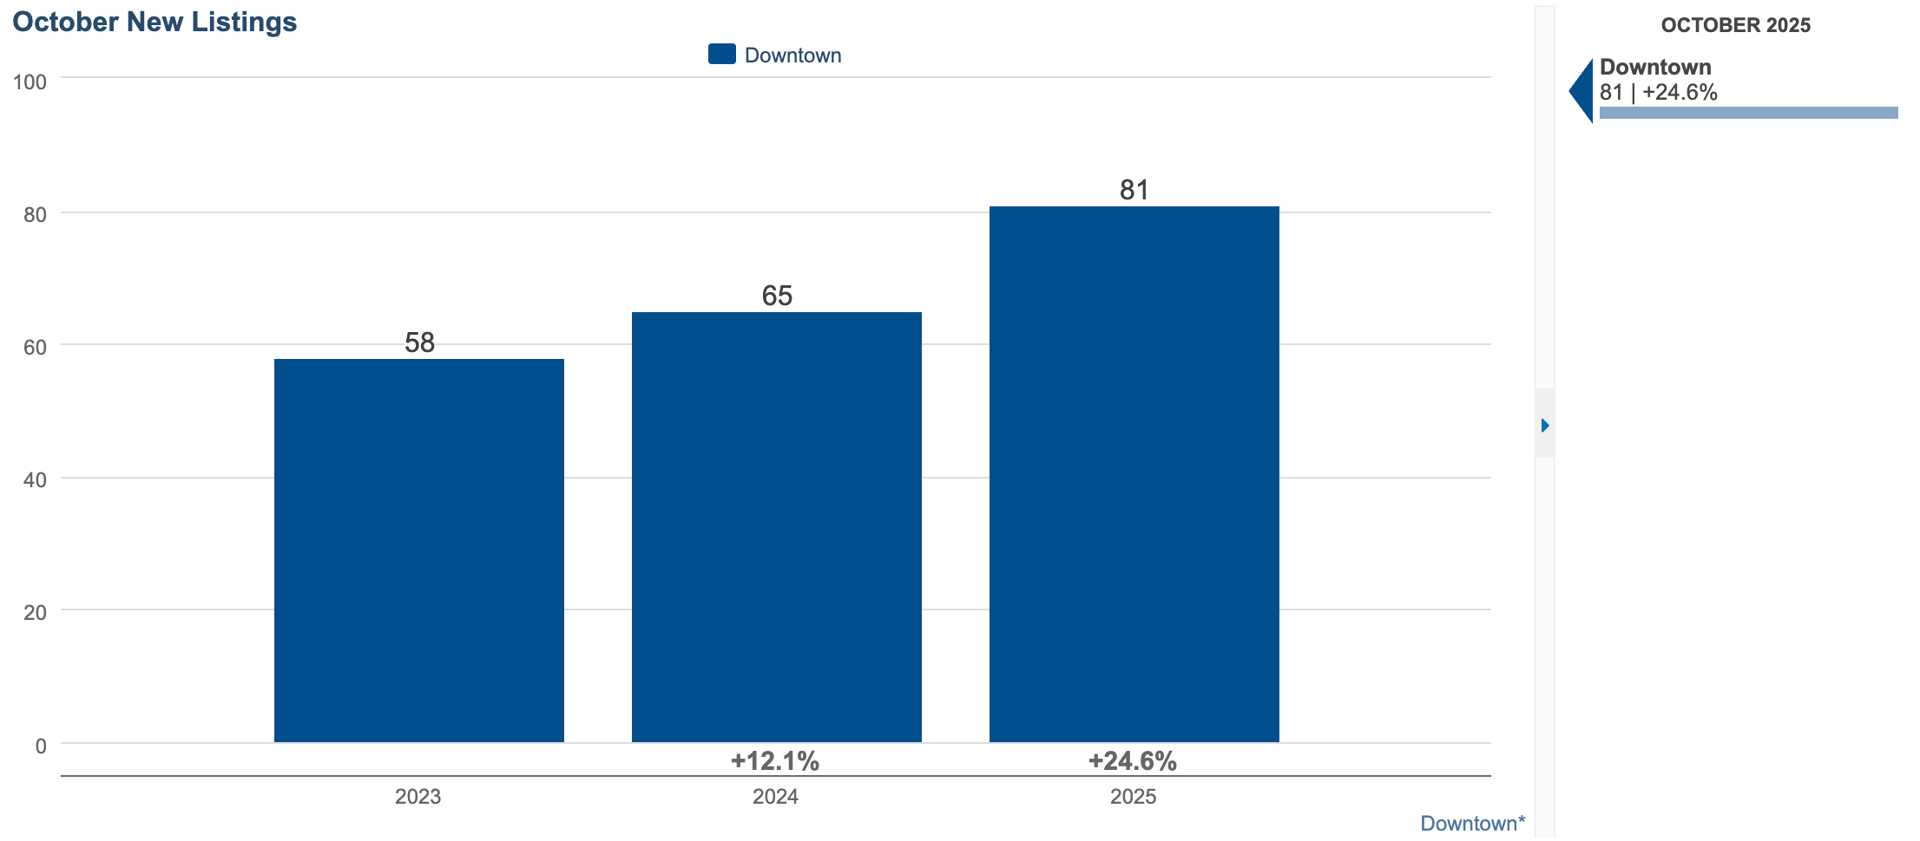
October 2025: 81 (+24.6% YoY)
YTD 2025: 889 (+5.2% YoY)
October saw a strong uptick in new listings, up nearly 25% compared to last year. This notable increase reflects growing seller confidence and perhaps recognition that buyers are active again heading into year-end. The YTD rise of 5.2% shows a healthy rebound in listing activity compared to the supply shortages that defined 2023 and early 2024.
More inventory means more choices for buyers — but it also introduces more competition among sellers. Well-prepared, properly priced listings are standing out, while others are taking longer to capture attention.
Pending & Closed Sales
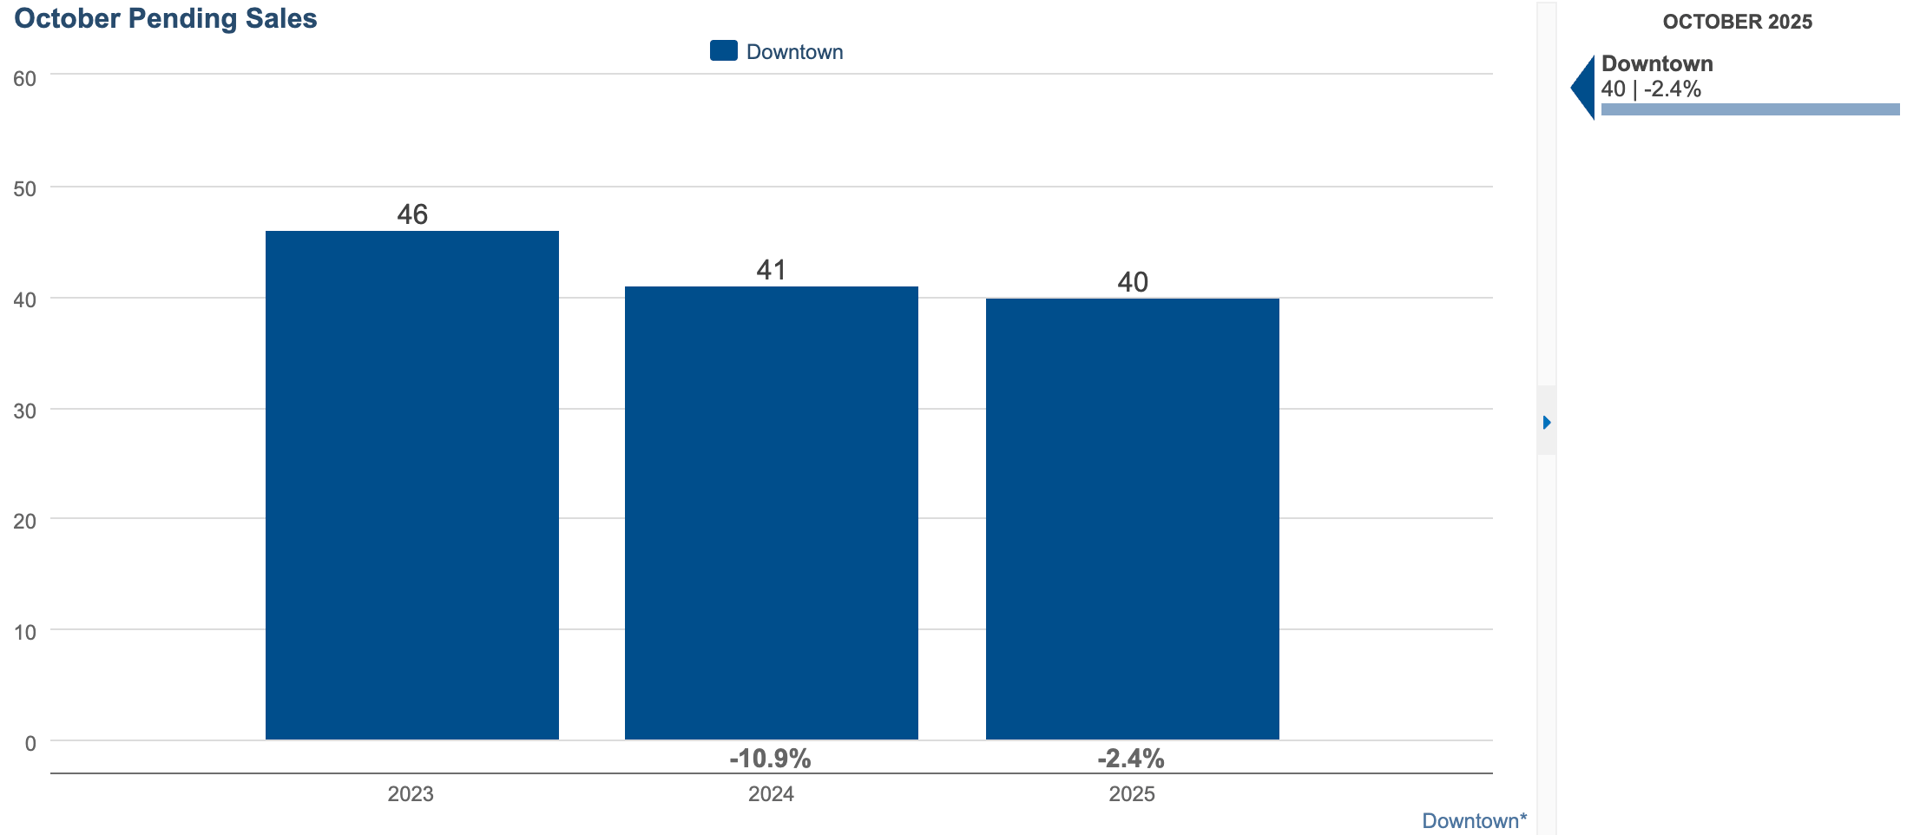
Pending Sales:
-
October 2025: 40 (-2.4% YoY)
-
YTD 2025: 462 (+4.3% YoY)
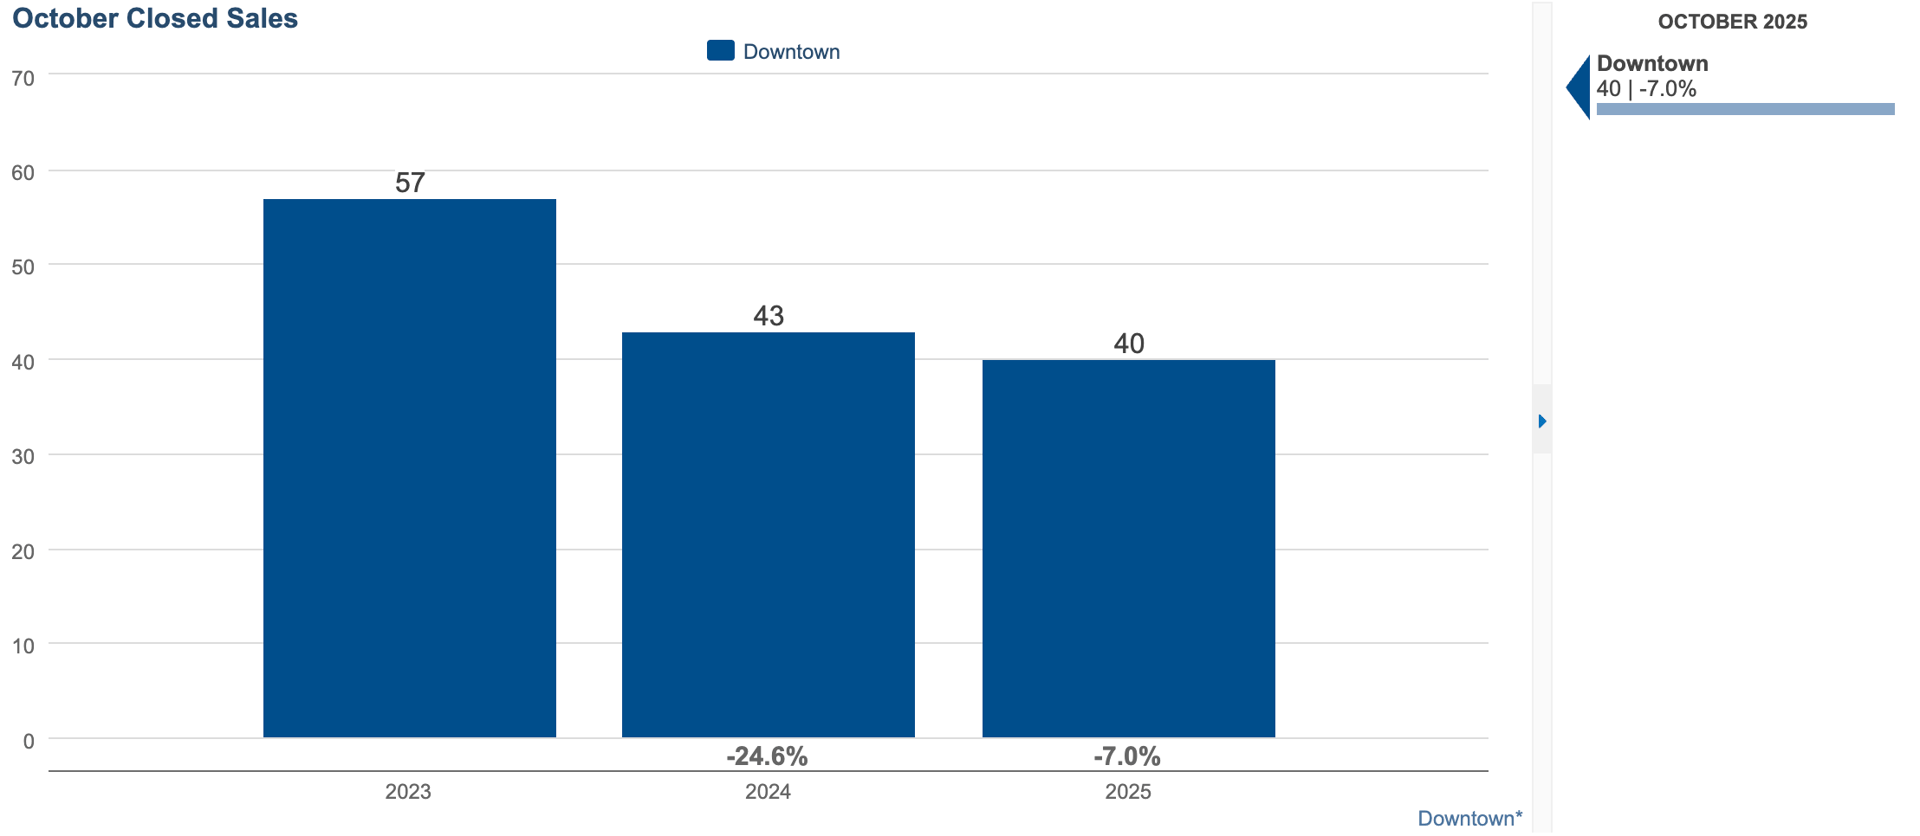
Closed Sales:
-
October 2025: 40 (-7% YoY)
-
YTD 2025: 467 (+8.1% YoY)
While October’s month-over-month slowdown shows buyers taking a measured approach, the broader year-to-date picture remains positive. Closed sales are up over 8% for the year, signaling that downtown living continues to appeal to buyers who value location, amenities, and lifestyle.
This contrast — slightly softer monthly numbers paired with solid annual growth — suggests the downtown market is balancing itself. Seasonal shifts and longer decision-making timelines are affecting short-term activity, but overall demand remains steady.
Median Days on Market
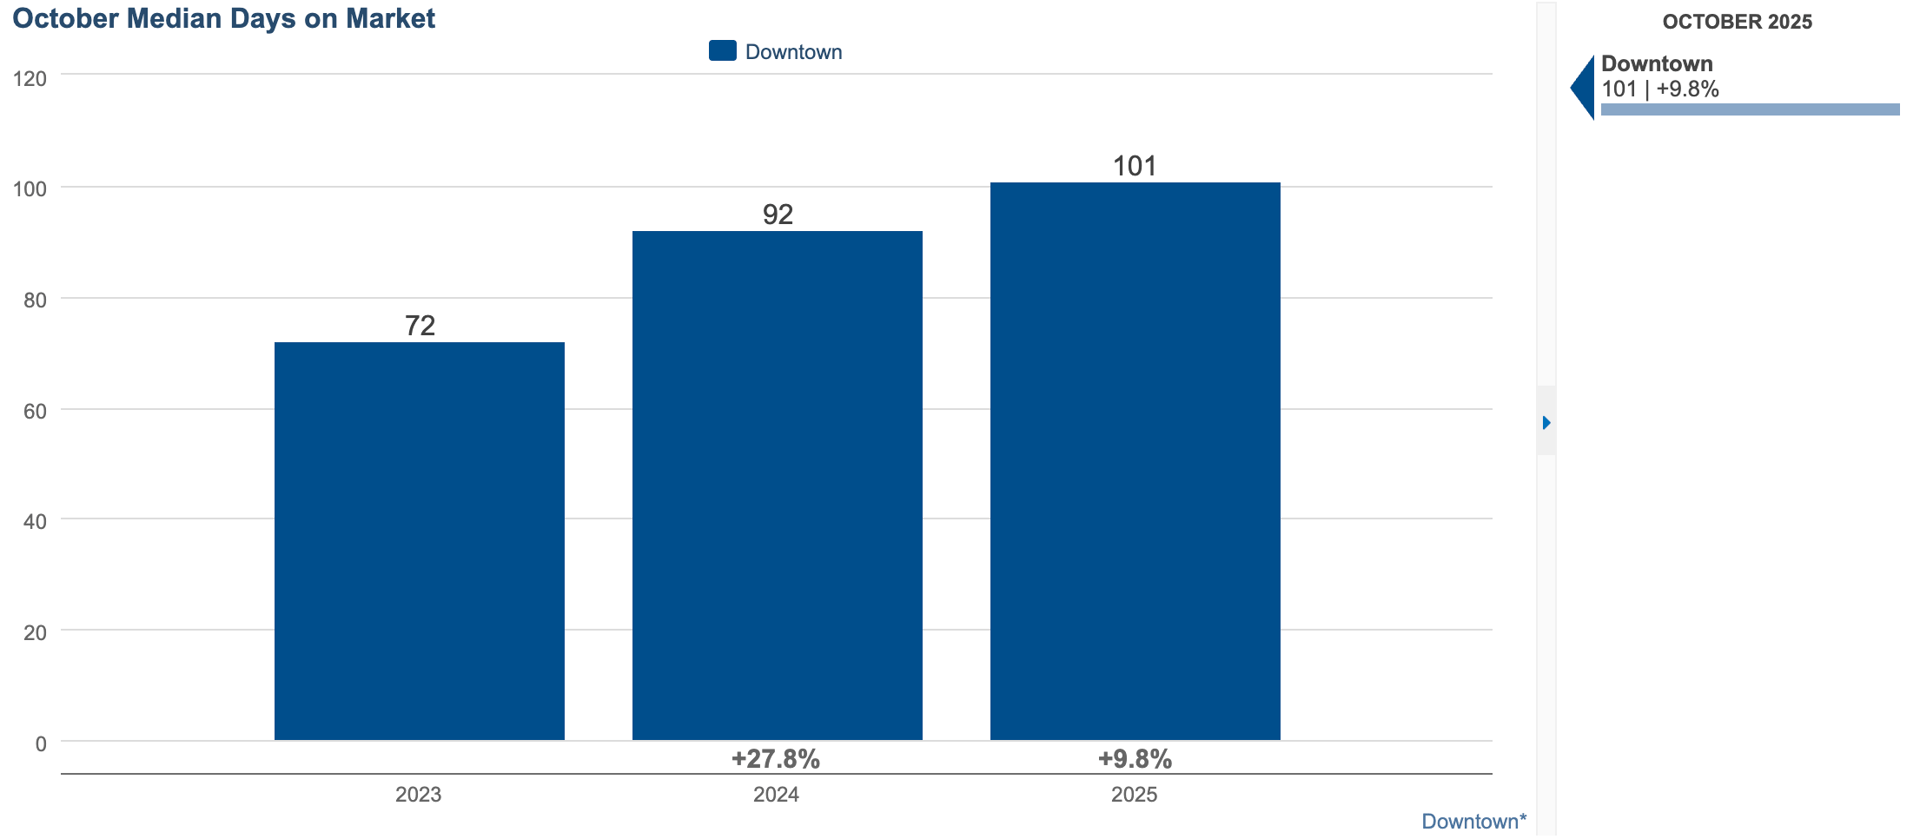
October 2025: 101 days (+9.8% YoY)
YTD 2025: 72 days (+28.6% YoY)
Properties are taking longer to sell, both month-over-month and year-to-date. The typical downtown condo is now spending about three months on the market, which reflects a more balanced environment than the faster-paced years following the pandemic.
For sellers, this means patience is key — today’s buyers are discerning, exploring multiple options before committing. For buyers, it means opportunity: less competition while still moving within a stable market.
Median Sales Price
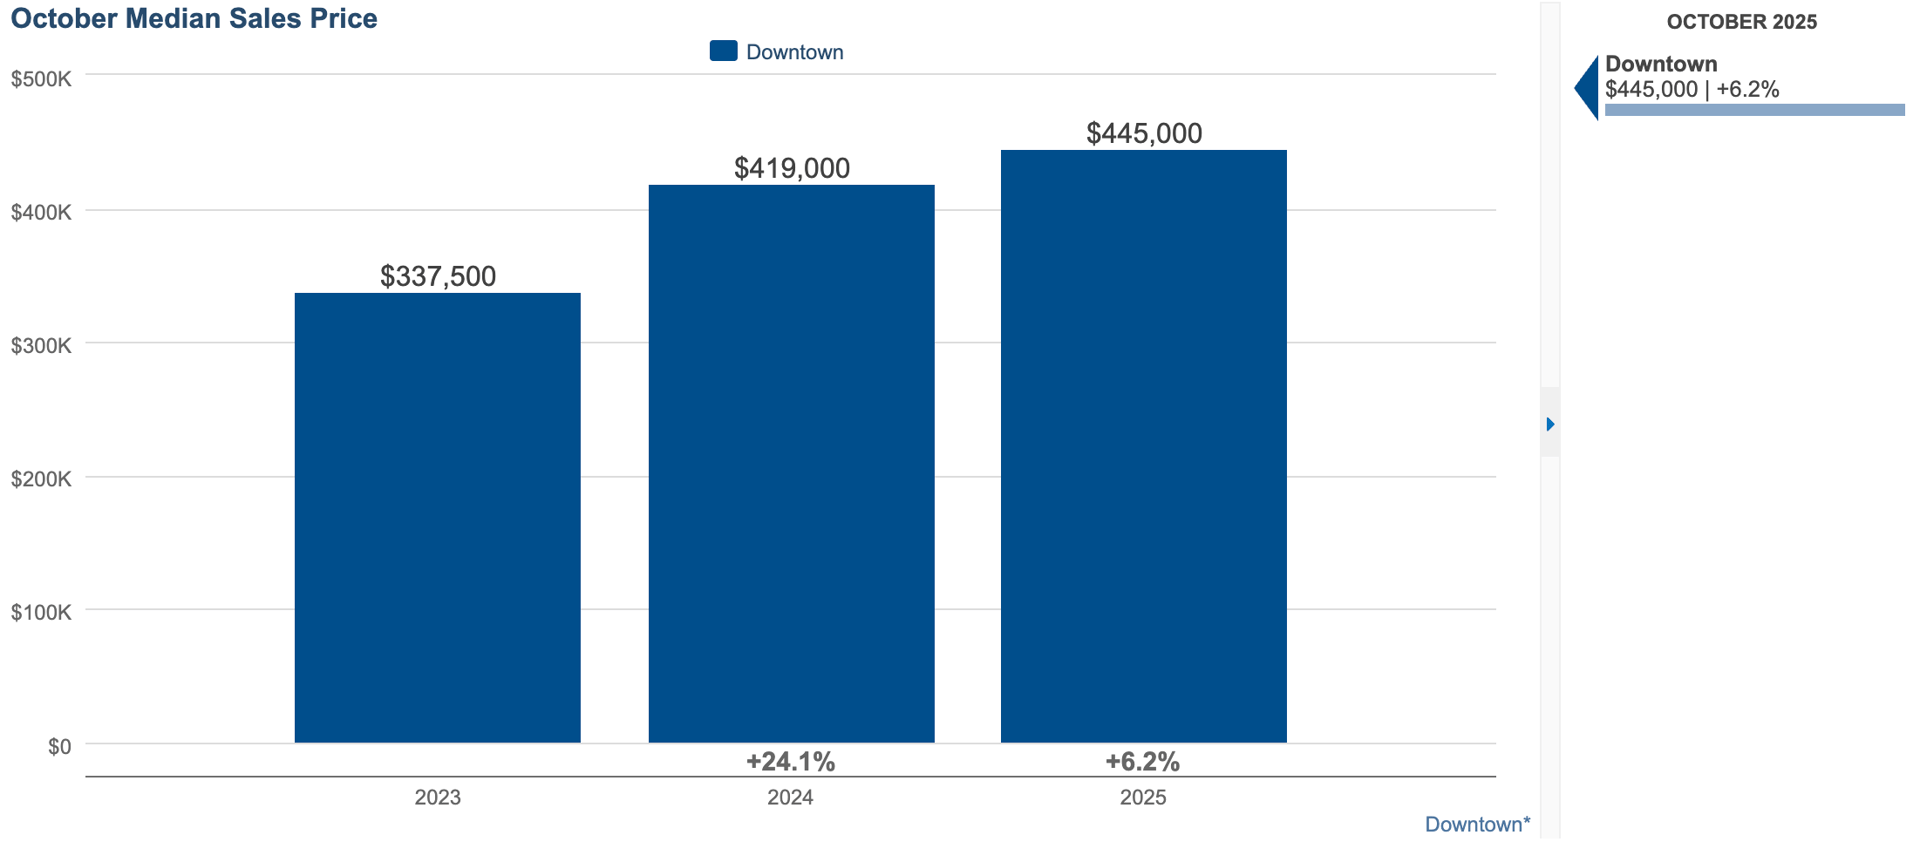
October 2025: $445,000 (+6.2% YoY)
YTD 2025: $355,000 (-6.8% YoY)
Prices tell a split story again this month. October alone saw a solid rise of 6.2% compared to 2024, highlighting that desirable listings — especially those offering modern updates, views, or unique layouts — are commanding top dollar.
However, the year-to-date figure remains down 6.8%, signaling a market readjusting from the luxury-heavy mix of prior years. With fewer high-end sales driving the average, the YTD number now better represents the mid-market downtown condo buyer.
Median Price per Square Foot
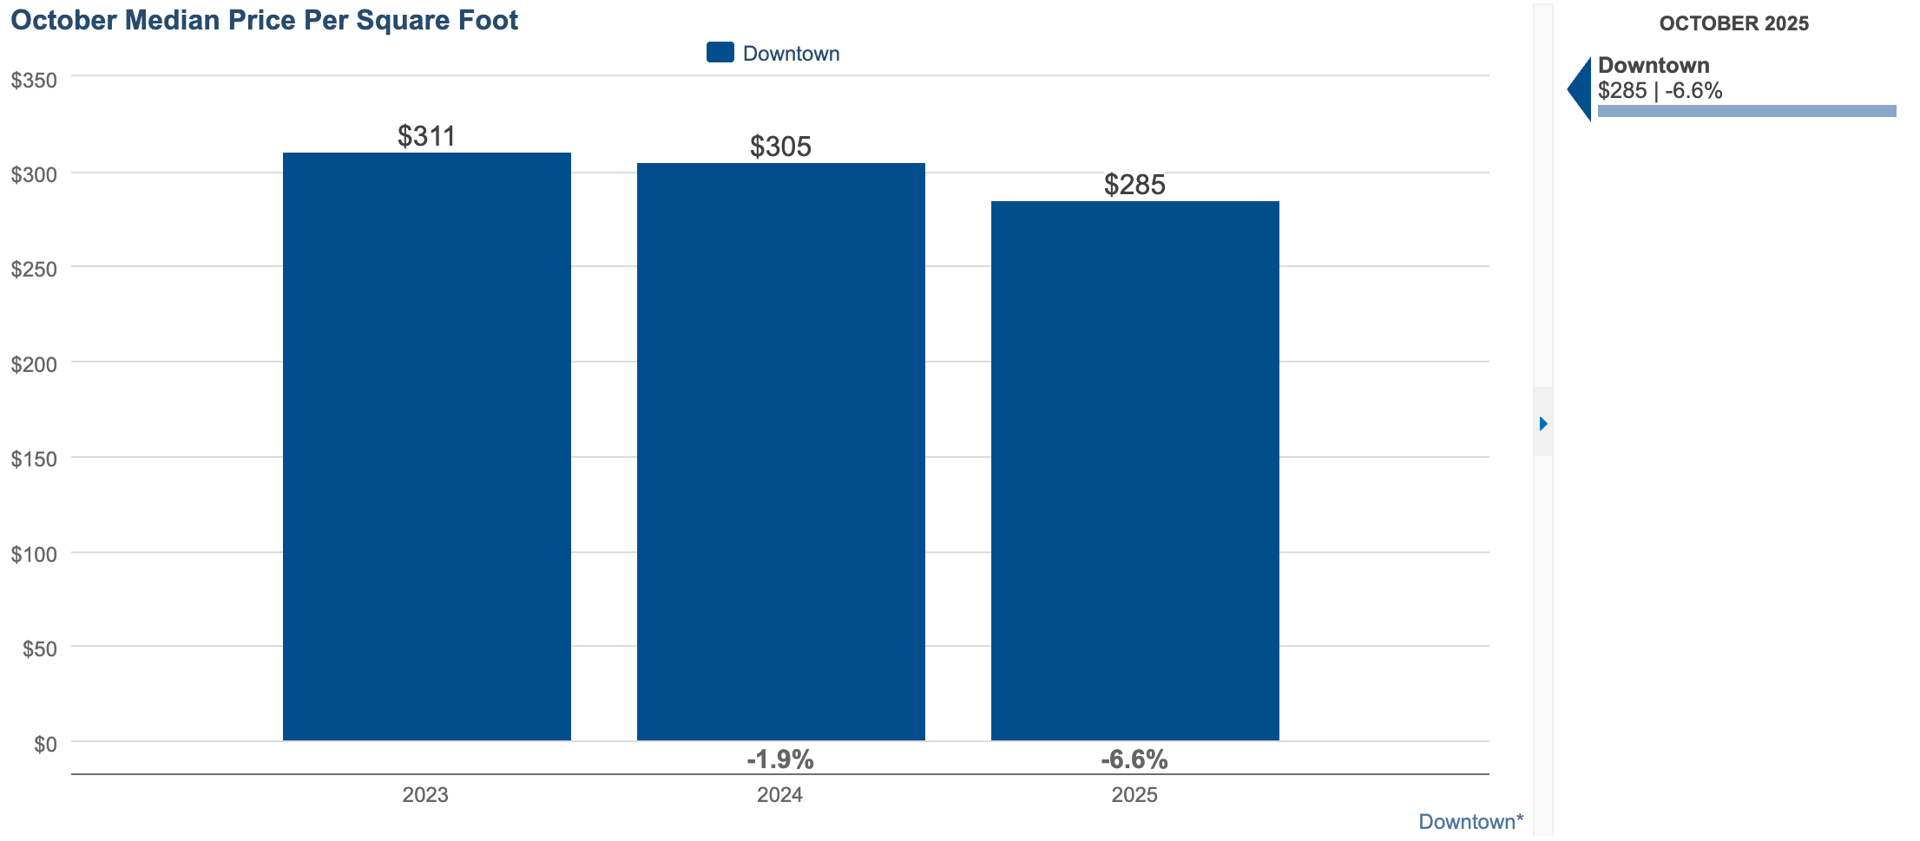
October 2025: $285 (-6.6% YoY)
YTD 2025: $301 (-3.8% YoY)
The decline in price per square foot follows the same pattern: a normalization from last year’s elevated levels. Buyers are seeking more space and value, opting for larger units or older buildings where their dollars stretch further. This trend underscores the shift toward practicality and long-term appeal rather than record-setting prices.
Inventory & Supply: Year-to-Date Data
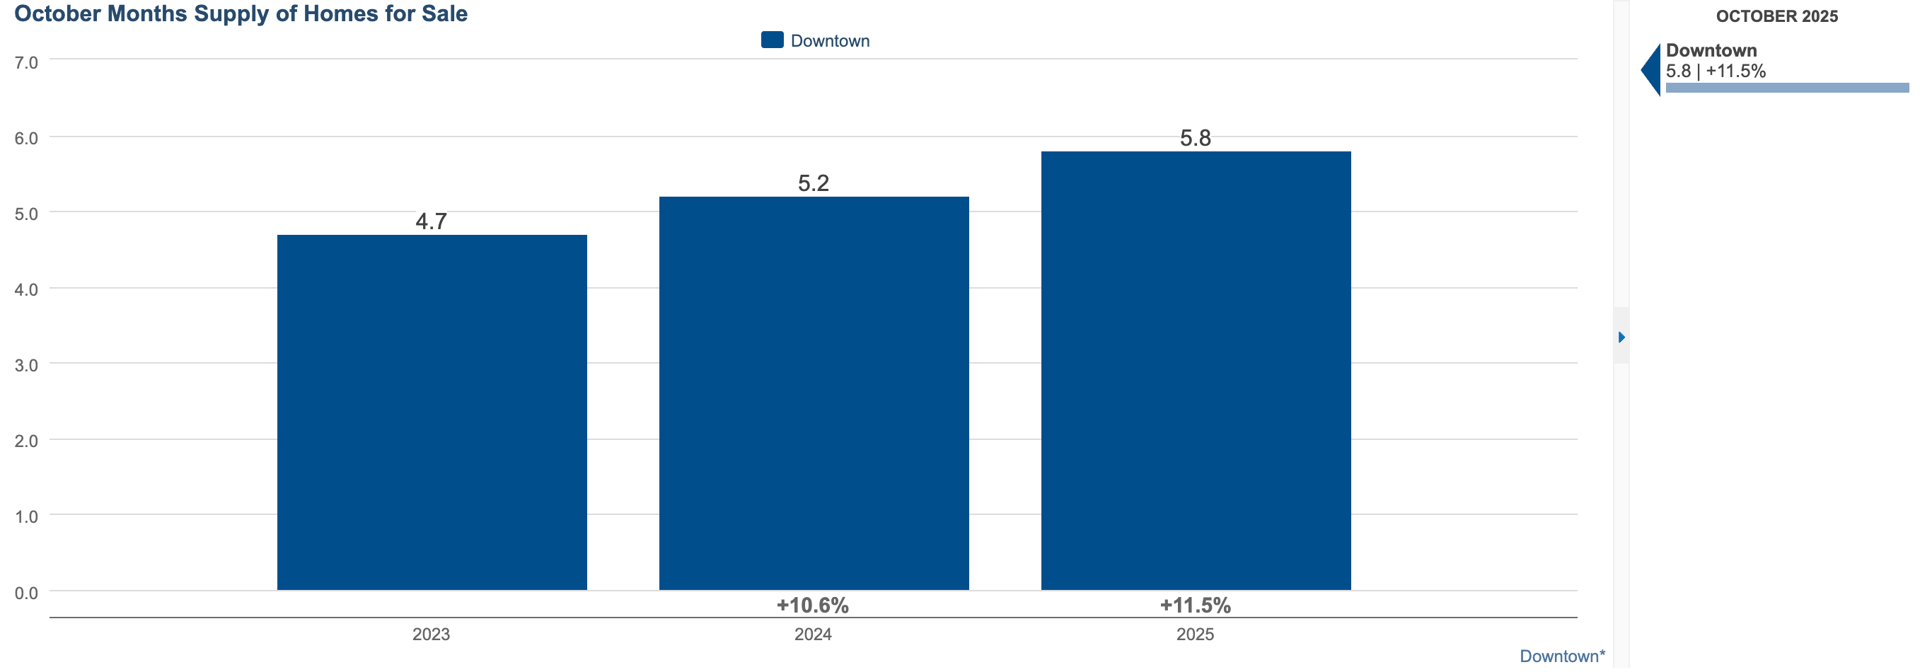
Overall Months Supply of Homes: 5.8 months (+11.5% YoY; 4.7 months in 2023)
Inventory has continued its gradual climb over the past three years, rising to nearly six months of supply — a clear indicator of a balancing market between buyers and sellers. Buyers have more breathing room, while sellers face a more discerning audience. For downtown, this balance is healthy: it supports price stability while reintroducing the steady rhythm of listings and absorption that defines sustainable growth.
The Broader Picture
Downtown Minneapolis continues to demonstrate balance and resilience as 2025 winds down. The surge in new listings, coupled with a steady pace of closings, points to a market that’s neither overheated nor cooling dramatically. Instead, it’s recalibrating — offering more predictability for both buyers and sellers.
With inventory trending up, days on market extending, and pricing stabilizing, it’s a time that rewards strategy. Sellers who invest in presentation and accurate pricing are seeing results, while buyers benefit from increased options and negotiating leverage.
Downtown remains one of the Twin Cities’ most unique and vibrant markets, appealing to those drawn to walkable neighborhoods, cultural amenities, and the convenience of urban living.
REACH OUT TO DISCUSS HOW THESE NUMBERS AFFECT YOUR MARKET TIMING AT [email protected]
Data retrieved from the NorthStarMLS via map of Downtown Minneapolis Neighborhoods including: Loring Park, Elliot Park, Downtown West, Central Minneapolis, North Loop, East Town, Mill District, Nicollet Island, St. Anthony West, and Marcy-Holmes.
HAVE QUESTIONS ABOUT DOWNTOWN MINNEAPOLIS OR SURROUNDING REAL ESTATE MARKETS?
Contact our team by call, email, or submitting a form at: https://lynnburnrealestate.com/