
September brought a notable up-shift in the Downtown Minneapolis real estate market. While fewer new listings came to market and closed sales remained slightly below last year, the properties that did sell moved considerably faster - and at higher prices.
The combination of shorter marketing times, higher median prices, and rising price per square foot suggests that demand remains strong for properties that align with what today's buyers are looking for. At the same time, the decline in new listings means buyers have fewer fresh options entering the market as we move into fall.
New Listings
September 2026: 75 (-13.8% YoY)
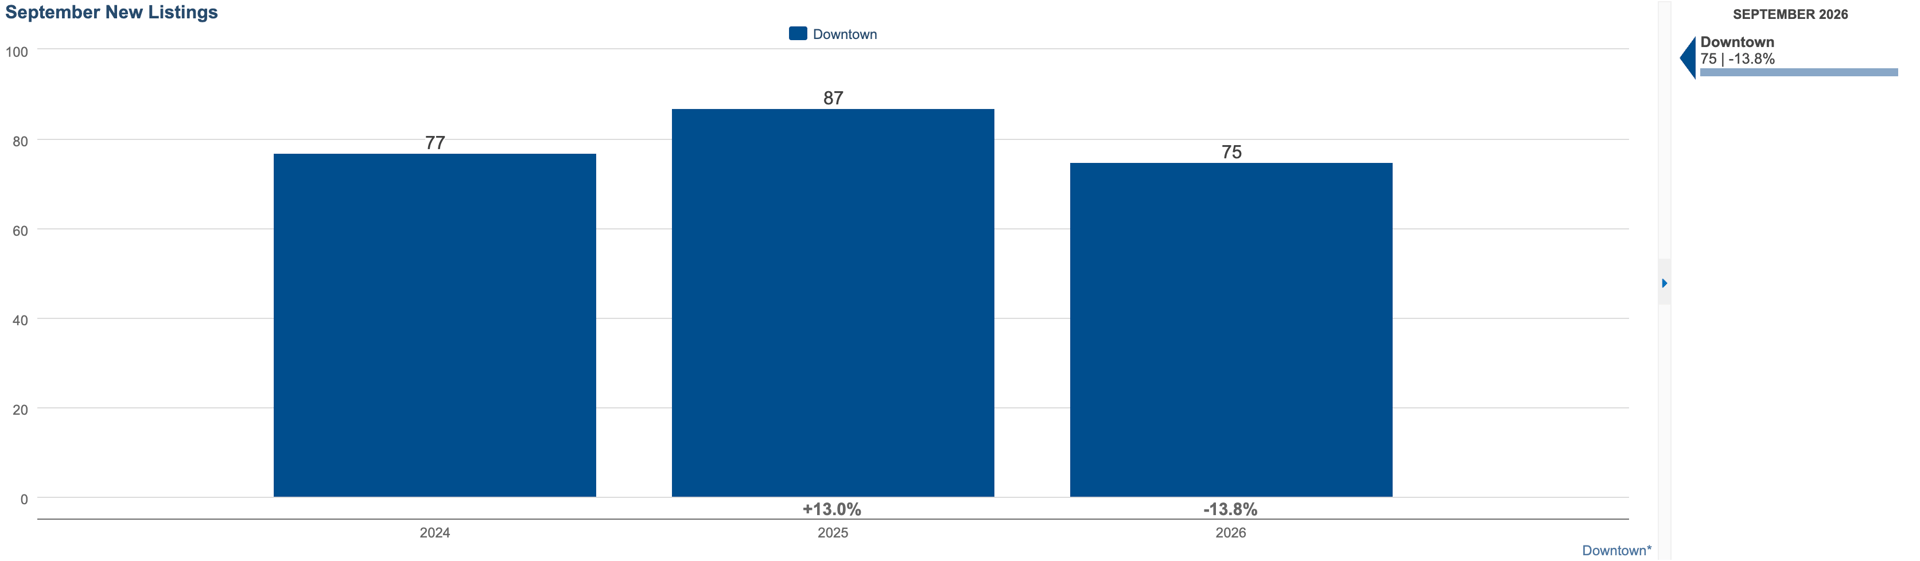
New listings declined nearly 14% compared with September 2025, marking a meaningful reduction in fresh inventory.
This creates an interesting dynamic heading into the traditionally quieter fall and winter months.
For sellers, the smaller flow of new inventory can create an opportunity for a well-positioned property to stand out - particularly when it offers something buyers aren't seeing repeatedly in the current market.
Closed Sales
September 2026: 44 (-4.3% YoY)
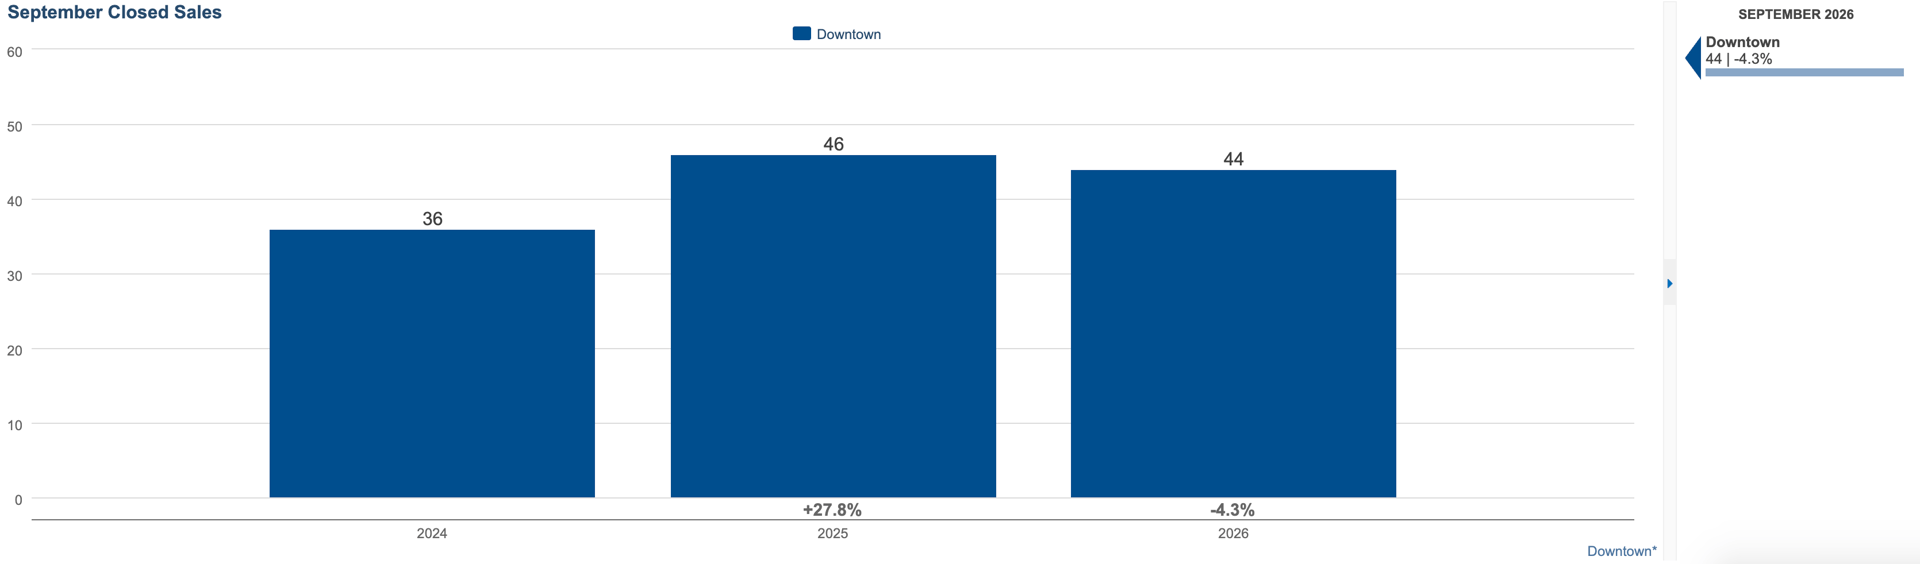
Closed sales were only modestly below last year's level, despite the decline in new listings.
This suggests that buyer activity has remained relatively resilient. While the overall number of transactions is slightly lower, the market continues to produce a steady volume of successful sales.
Combined with the significant improvement in days on market, September's numbers suggest that buyers who are finding the right property are continuing to move forward.
Median Days on Market
September 2026: 41 days (-51.2% YoY)
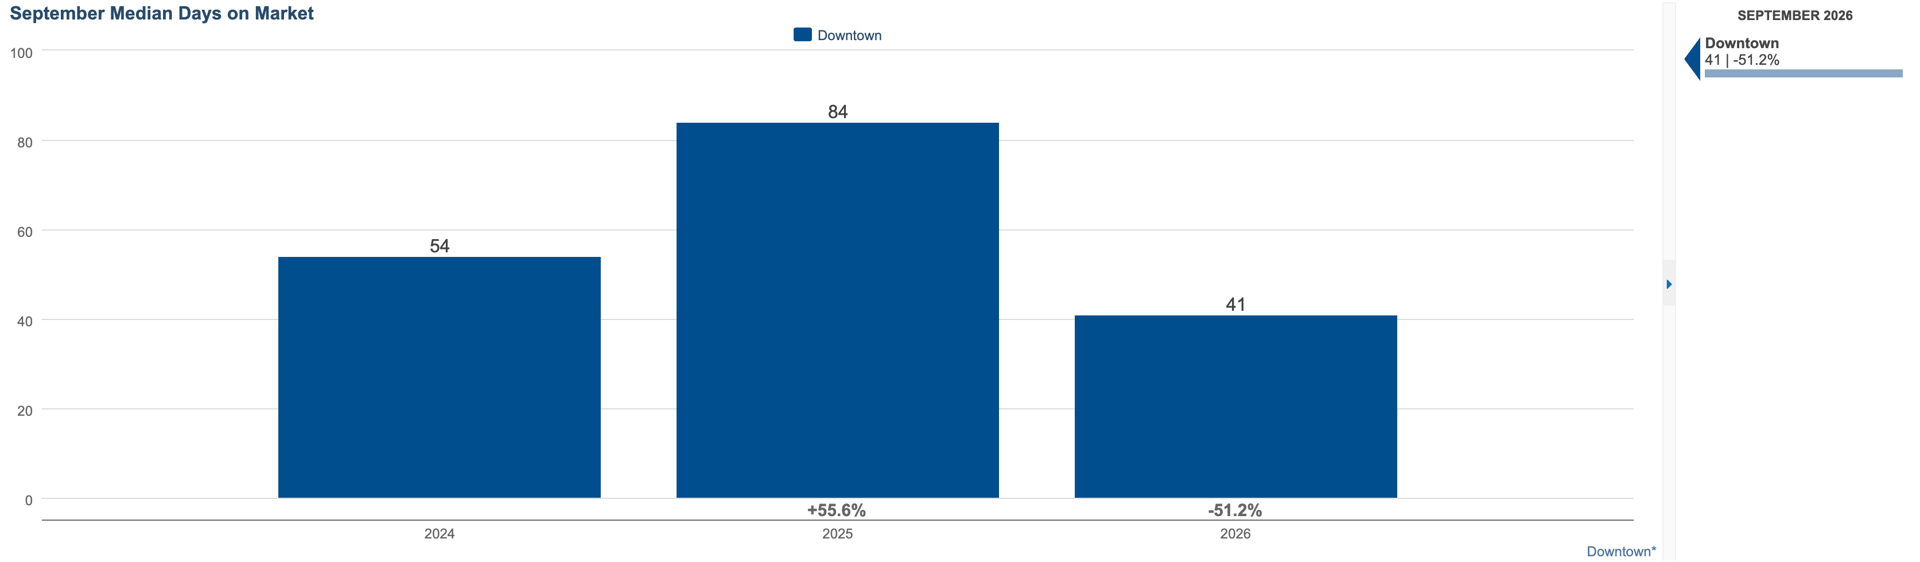
One of September's most striking numbers is the 51.2% decrease in median days on market.
The typical property that sold this month spent just 41 days on the market - less than half the time of a year ago, and even quicker than in September 2024.
This is an important distinction from simply saying the market is "busy." It suggests that when a property is appropriately priced and well-positioned for its particular segment, buyers are willing to act quickly. Also key are pre-market sales, which often incur "0" days on market.
After a year characterized by more deliberate decision-making, September shows that select properties can still generate meaningful momentum.
Median Sales Price
September 2026: $451,200 (+28.2% YoY)
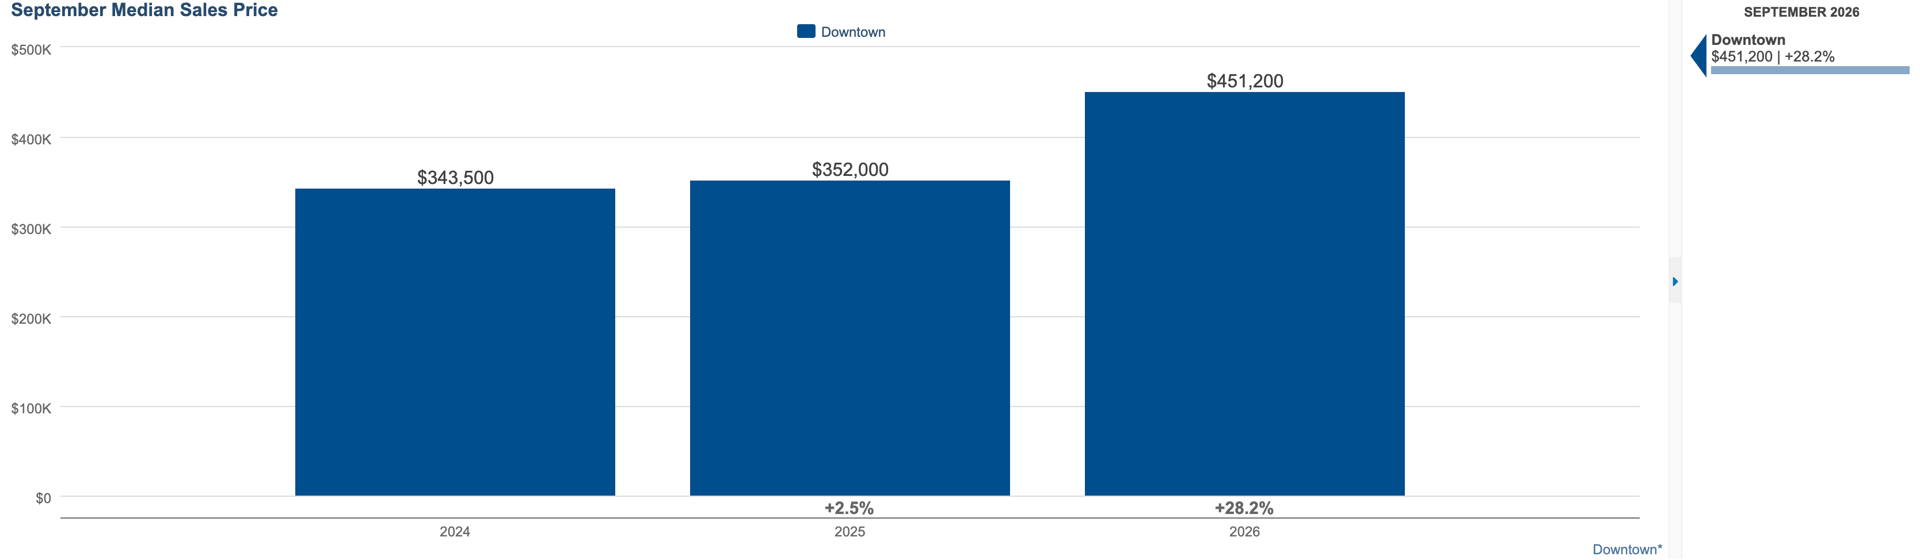
The median sales price increased substantially compared with September 2025, reaching more than $450,000.
As always, a monthly median should be interpreted in the context of the properties that happened to close during that period. Downtown Minneapolis includes a wide range of condominium and residential properties, from more attainable units to luxury residences, so the composition of monthly sales can meaningfully influence the median.
Still, the increase is significant and reinforces the strength we're seeing among higher-value and well-positioned downtown properties and looking at Median Price Per Square Foot helps us round out a positive picture.
Median Price Per Square Foot
September 2026: $319 (+4.2% YoY)
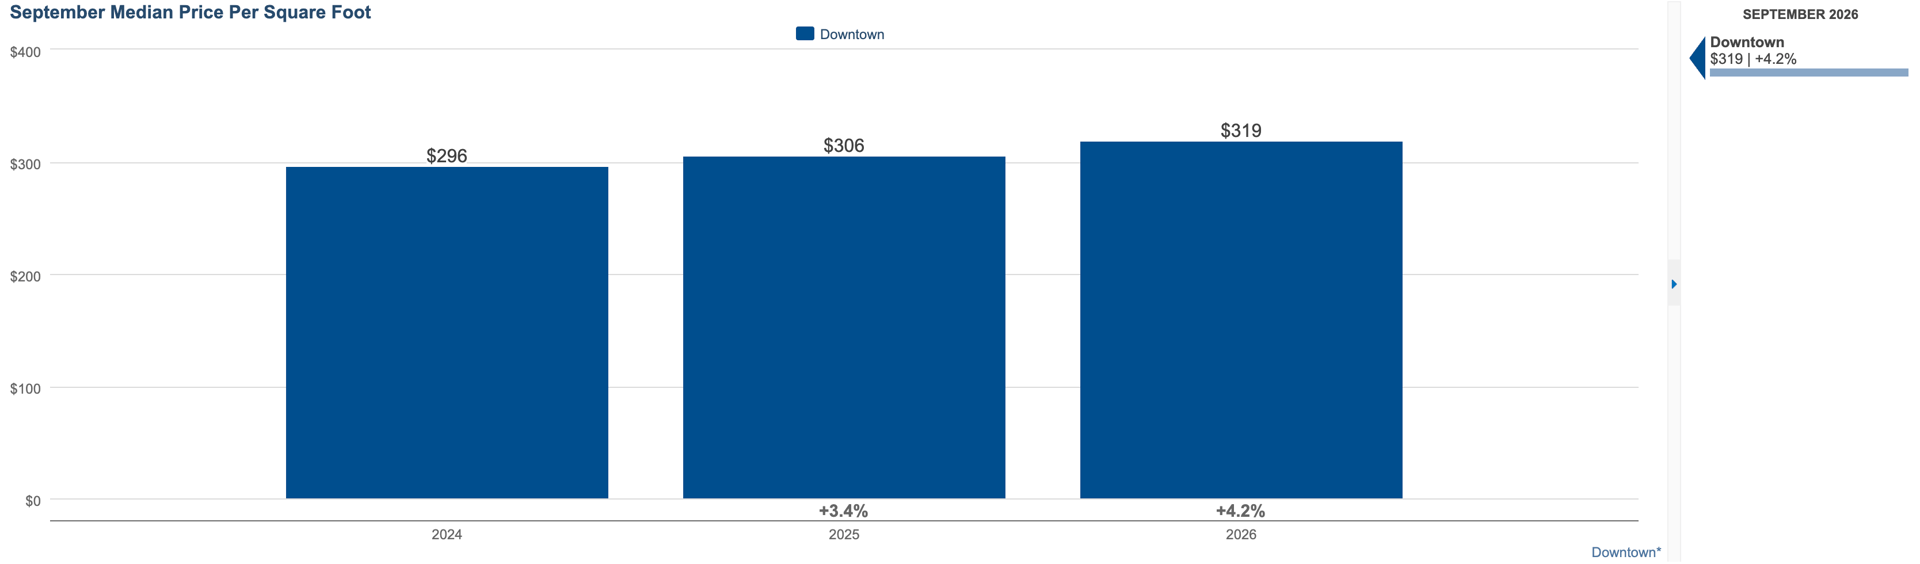
Median price per square foot also increased, rising 4.2% year-over-year.
This provides another useful perspective on September's pricing. While the median sales price can be influenced by the size and mix of homes sold, price per square foot offers a way to look more closely at the value buyers are placing on the space itself.
The combination of a higher median sale price and higher price per square foot suggests that September's stronger pricing wasn't simply a result of larger properties selling. Buyers continue to place value on desirable Downtown Minneapolis residences.
The Broader Picture
September's numbers tell a particularly interesting story: less inventory, relatively steady sales, significantly faster selling times, and stronger pricing.
That is a different picture from earlier in 2026, when buyers were generally taking more time and the market was characterized by greater deliberation. By September, the properties that were well-positioned for their market segment appear to have been finding buyers considerably faster.
For Downtown Minneapolis, this reinforces something we've seen throughout the year: the market isn't moving uniformly. Building, location, condition, amenities, views, HOA considerations, and price all play an important role in how a property performs.
For Sellers, September's results underscore the importance of understanding the competitive landscape before coming to market.
For Buyers, fewer new listings mean that identifying the right opportunity - and being prepared to act when it appears - can become increasingly important as we move into the final months of the year.
The Downtown Minneapolis market continues to evolve, but one thing remains consistent: strategy matters.
REACH OUT TO DISCUSS HOW THESE NUMBERS AFFECT YOUR MARKET TIMING AT [email protected]
Data retrieved from the NorthStarMLS via map of Downtown Minneapolis Neighborhoods including: Loring Park, Elliot Park, Downtown West, Central Minneapolis, North Loop, East Town, Mill District, Nicollet Island, St. Anthony West, and Marcy-Holmes.
HAVE QUESTIONS ABOUT DOWNTOWN MINNEAPOLIS OR SURROUNDING REAL ESTATE MARKETS?
Contact our team by call, email, or submitting a form at: https://lynnburnrealestate.com/