
August brought more inventory to the Downtown Minneapolis market, but it also reinforced an important theme we've been watching throughout 2026: buyers have choices, and they're taking their time, but prices remain strong.
New listings increased more than 26% from last August, while closed sales edged down by 6% and the median time to sell rose to 85 days. At the same time, the median sale price climbed 12.4% to $416,000. Taken together, these numbers point to a market where pricing remains resilient, but buyers are being selective about where they spend their money.
For sellers, the message is clear: more inventory means positioning and staging matters. For buyers, the current environment offers time to compare properties and make thoughtful decisions without the urgency that characterized some earlier market cycles.
New Listings
August 2026: 91 (+26.4% YoY)
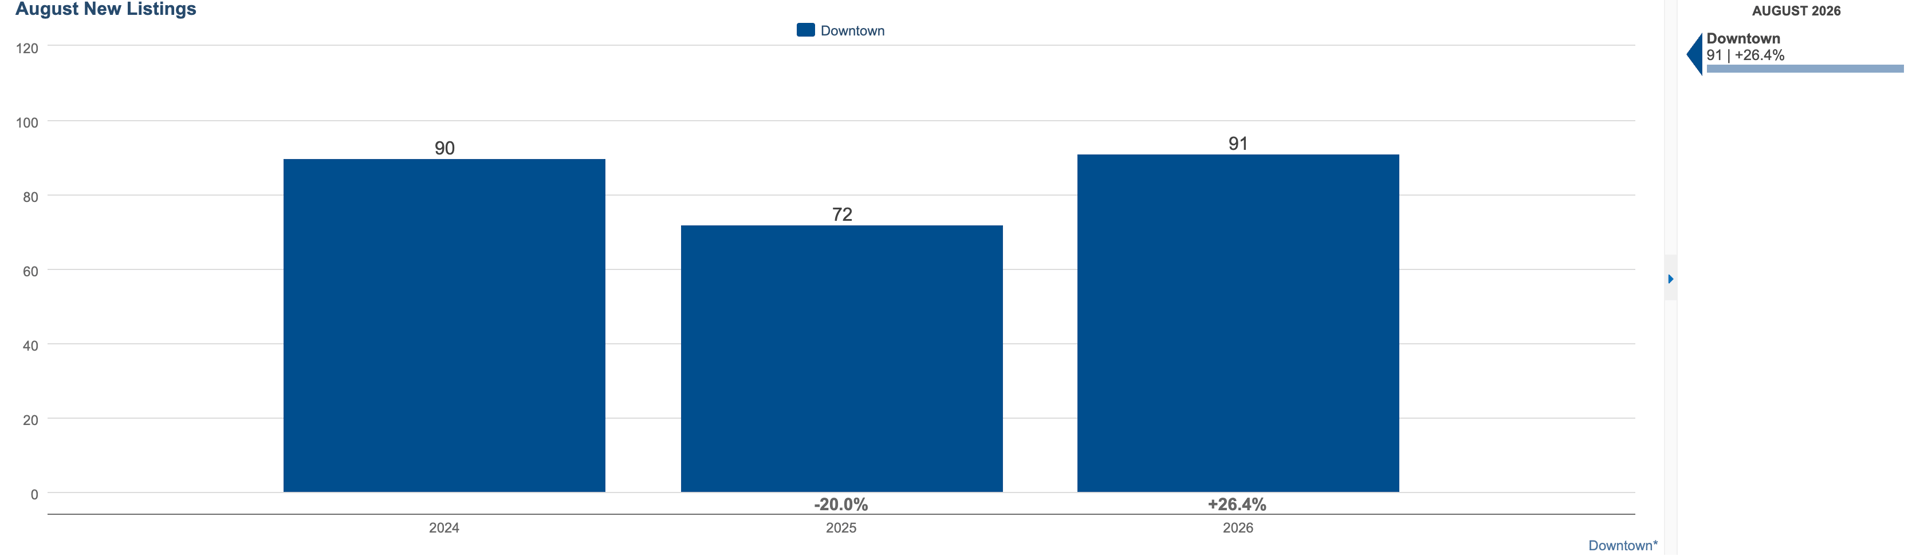
More than 25% more properties came to market this August than during the same month last year, giving buyers a significantly broader selection.
This increase is meaningful for Downtown Minneapolis, where inventory has been an important part of the market conversation. More homeowners appear willing to make a move, while buyers have more opportunities to find a residence that fits their needs rather than settling for what happens to be available.
The flip side is increased competition among sellers. With more properties vying for attention, the homes that are priced appropriately and presented thoughtfully have an advantage.
Closed Sales
August 2026: 47 (-6.0% YoY)
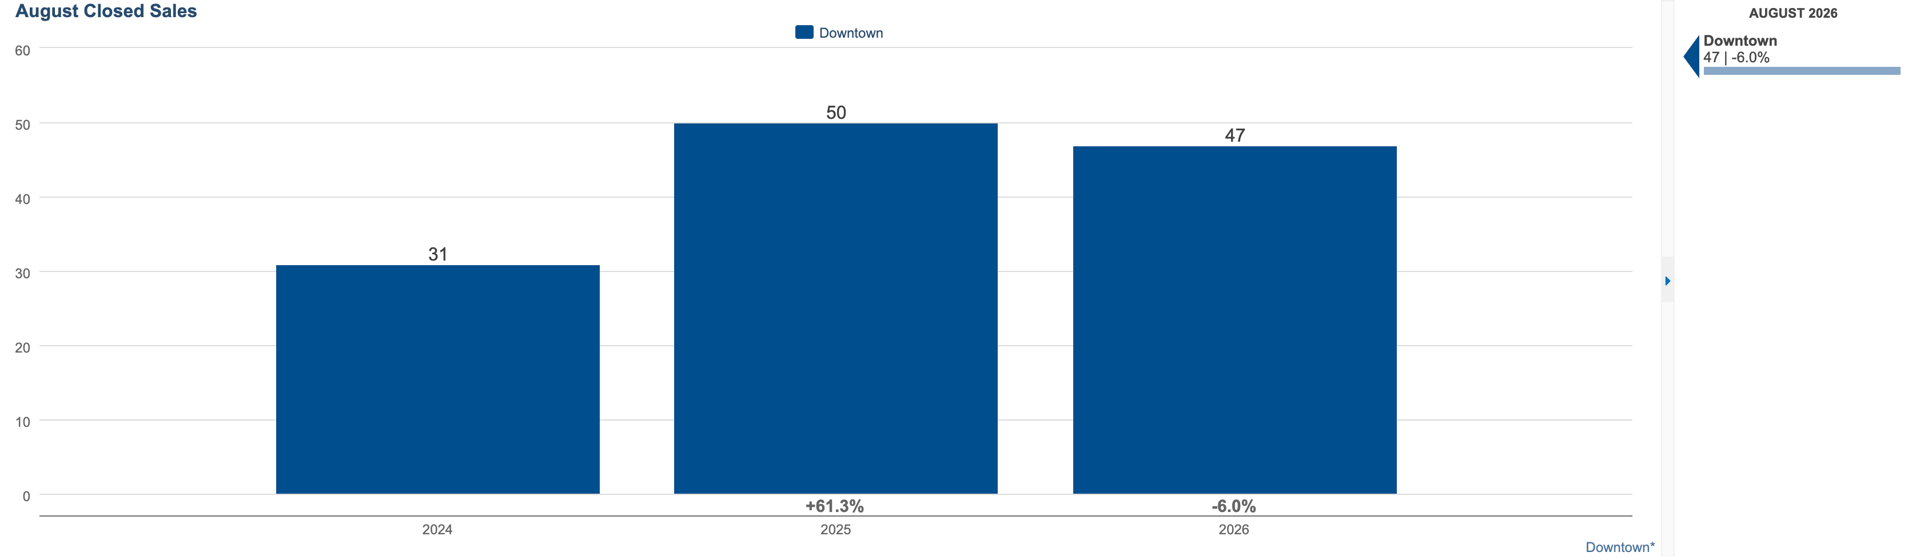
Despite the increase in available inventory, closed sales were modestly below last year's level.
That contrast is worth watching. Buyers are clearly engaging with the market, but having more choices appears to be extending the decision-making process. Rather than creating urgency, today's inventory allows buyers to compare buildings, amenities, condition, location, and price before committing.
This is particularly relevant in Downtown Minneapolis, where condo buyers can have very different experiences depending on the building and neighborhood.
Median Days on Market
August 2026: 85 days (+34.9% YoY)
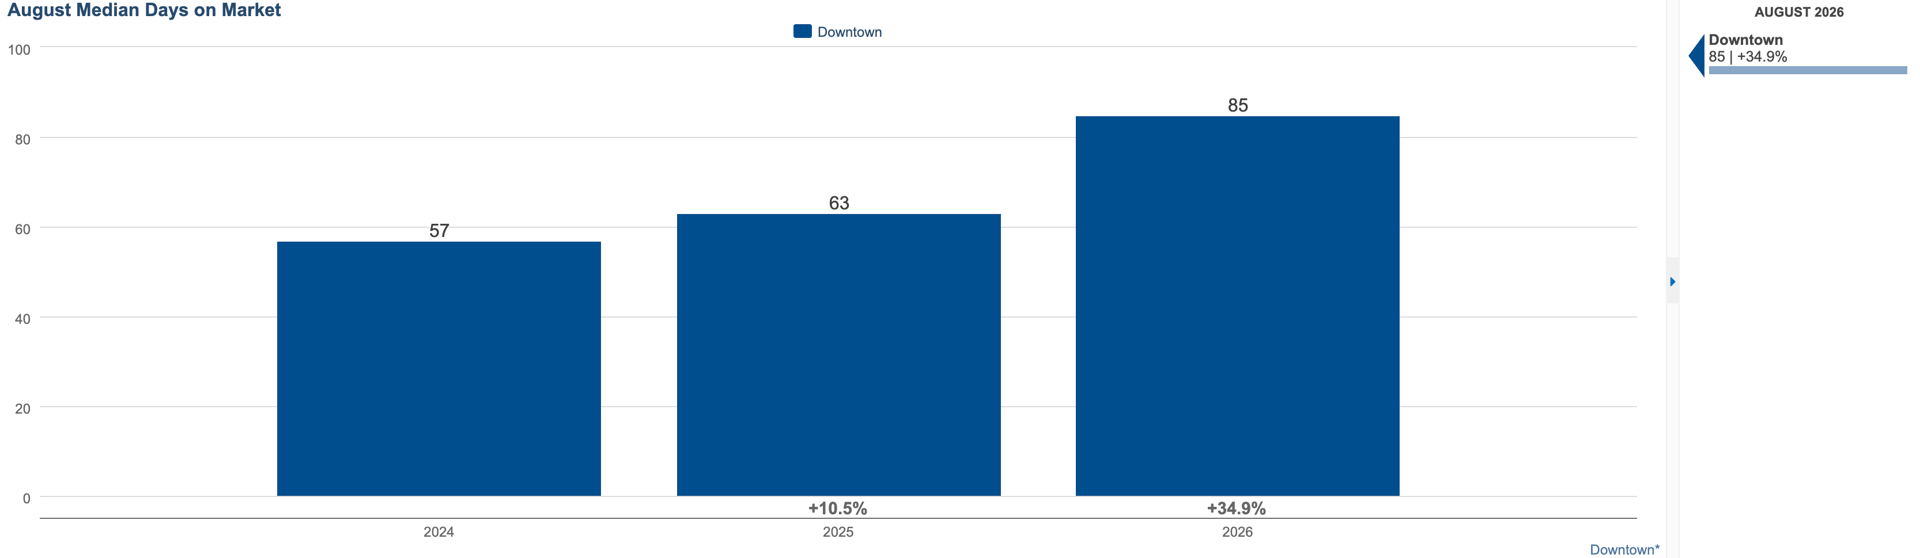
The median time to sell increased substantially, with properties taking roughly three weeks longer to sell than they did last August.
This is perhaps the clearest indication that today's market requires patience. A property may attract interest without immediately resulting in an offer, as buyers have more opportunities to evaluate their options.
For sellers, this makes accurate pricing especially important. The goal isn't simply to get a property on the market- it's to enter the market at a price and position that motivates buyers to act.
Median Sales Price
August 2026: $416,000 (+12.4% YoY)
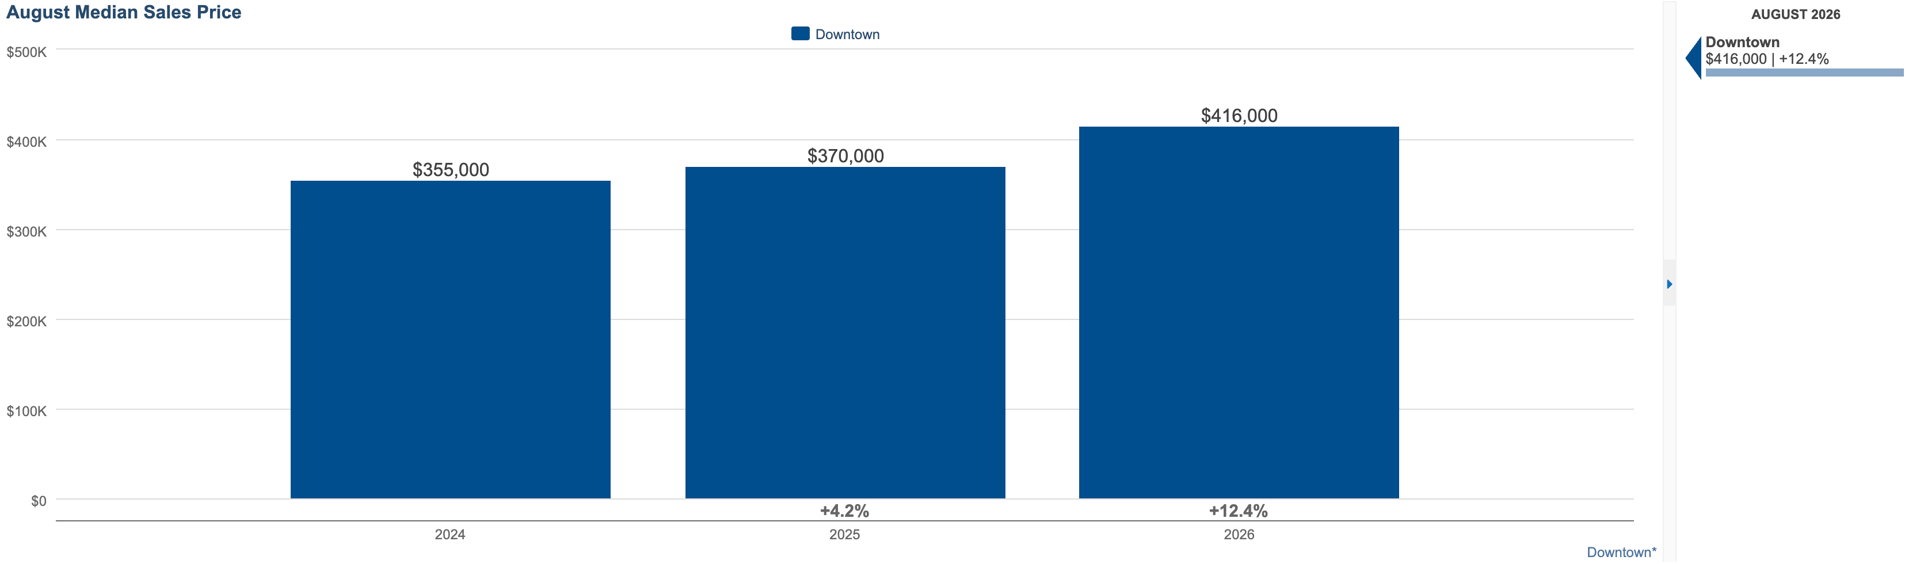
Despite slower transaction velocity, the median sales price increased more than 12% year-over-year.
That's an encouraging sign for Downtown Minneapolis property values, although monthly median prices should always be viewed in context. The mix of properties that sell in any given month can have a significant impact on the median, particularly in a condominium market with everything from entry-level residences to luxury properties.
Still, the increase reinforces a broader theme we're seeing this year: buyers may be selective, but they're willing to pay for the right property.
Median Price Per Square Foot
August 2026: $295 (+7.3% YoY)
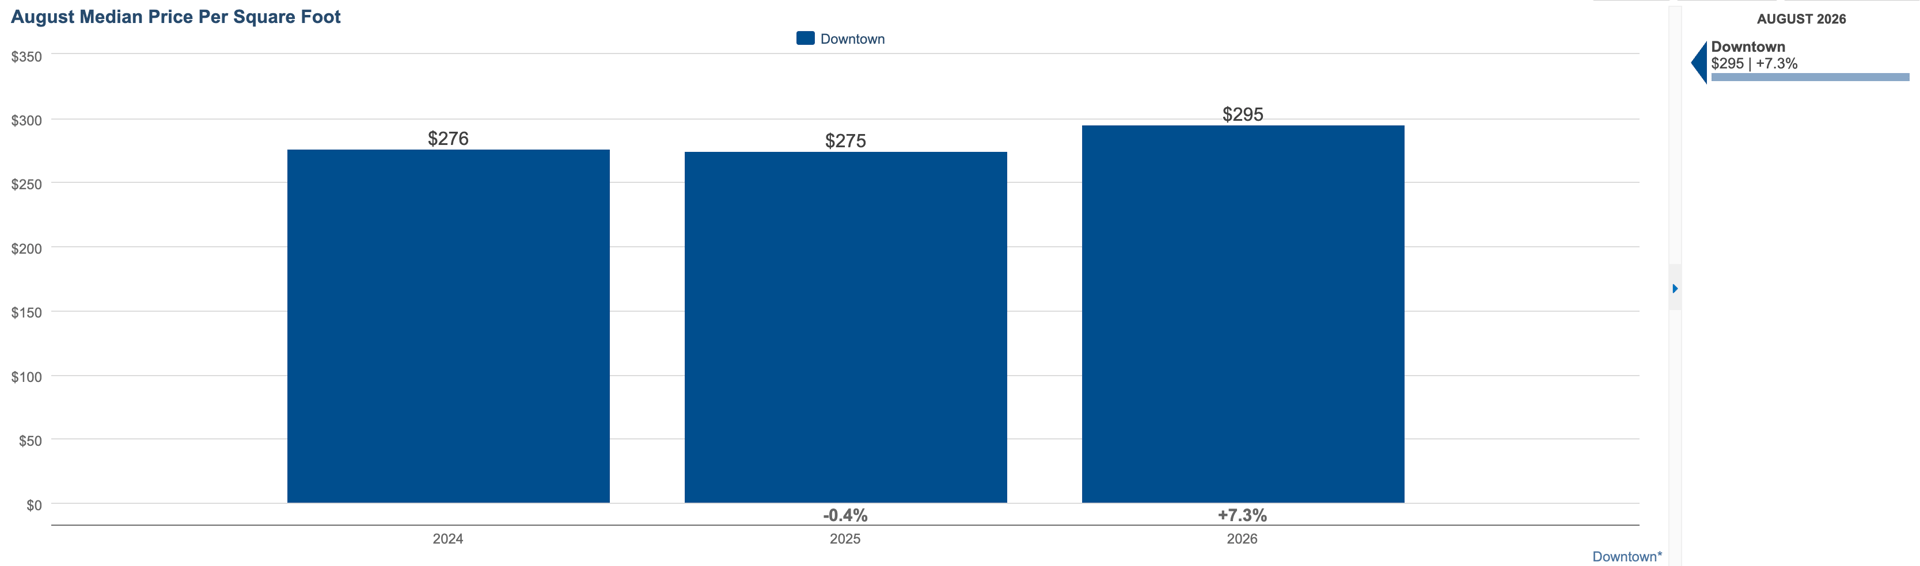
Median price per square foot increased 7.3% from last August, providing another indication that underlying property values remain resilient.
Viewed alongside the 12.4% increase in median sales price, this suggests that the higher pricing seen in August isn't solely the result of a different mix of properties closing. Buyers continue to place meaningful value on Downtown Minneapolis residences, particularly when a property offers the location, condition, amenities, views, or overall lifestyle they are seeking.
At the same time, buyers remain discerning. They're willing to pay for the right property—but they're taking their time to determine what "right" looks like.
The Broader Picture
August is a good reminder that market activity and market value aren't always moving in the same direction.
We have more listings, fewer closed sales, and longer timelines—but also higher median sales prices and price per square foot. That combination points to a market where buyers have regained some leverage, while desirable properties continue to command meaningful value.
For Downtown Minneapolis, this distinction matters. The market isn't treating every property equally. A residence with an excellent location, compelling views, thoughtful updates, strong amenities, and a well-managed building can perform very differently from a property that is less competitive within its category.
As we move toward fall, the opportunity on both sides is to be intentional. Buyers have more room to evaluate and negotiate, while sellers need to understand exactly where their property fits within the current competitive landscape.
The market is moving. It's simply asking everyone to be more thoughtful about how they move within it.
REACH OUT TO DISCUSS HOW THESE NUMBERS AFFECT YOUR MARKET TIMING AT [email protected]
Data retrieved from the NorthStarMLS via map of Downtown Minneapolis Neighborhoods including: Loring Park, Elliot Park, Downtown West, Central Minneapolis, North Loop, East Town, Mill District, Nicollet Island, St. Anthony West, and Marcy-Holmes.
HAVE QUESTIONS ABOUT DOWNTOWN MINNEAPOLIS OR SURROUNDING REAL ESTATE MARKETS?
Contact our team by call, email, or submitting a form at: https://lynnburnrealestate.com/