

The July 2025 Downtown Minneapolis housing market reflects a continued trend toward balance, with a modest rise in inventory, and slightly fewer luxury and overall sales than this time last year. Here’s a full breakdown of what changed this month compared to July 2024 — and what it means for buyers and sellers alike.
🏠 New Listings: 89 (Up 4.7%)
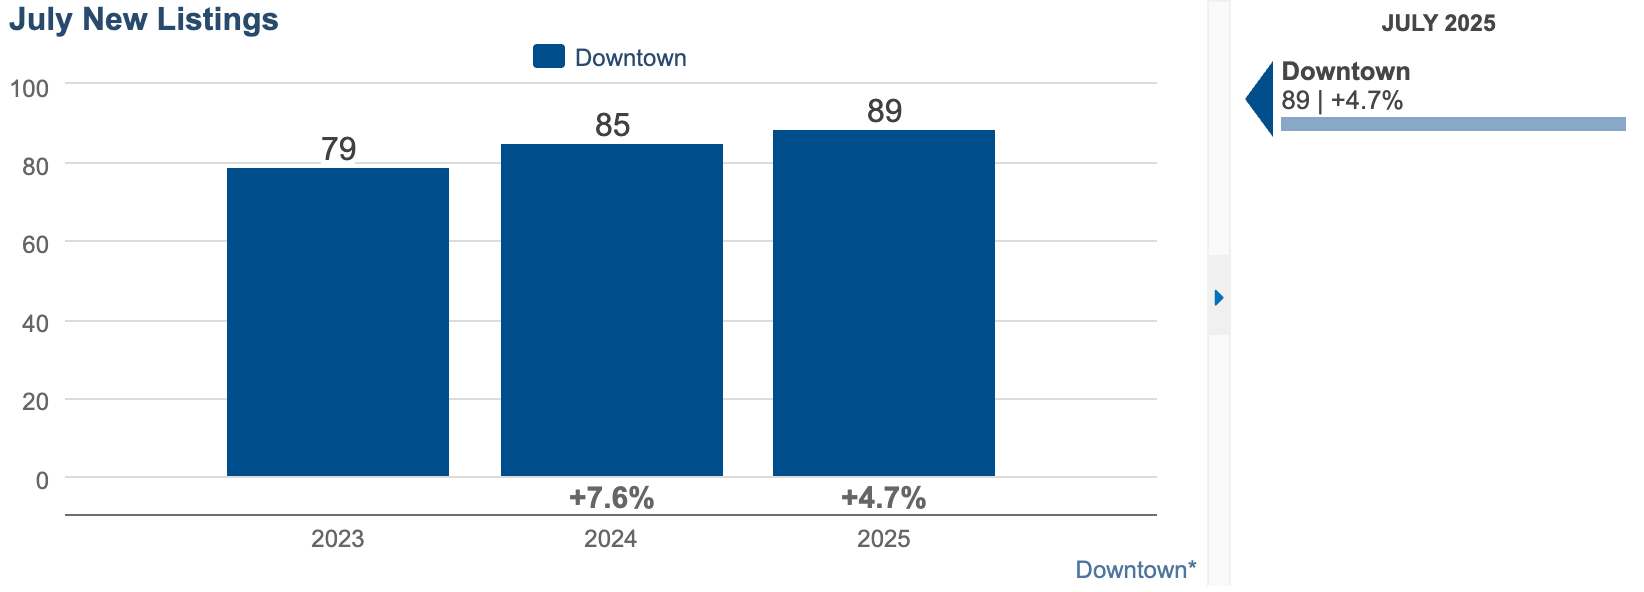
Inventory ticked up slightly, offering more options to buyers after a quieter start to to the summer market. This mild increase suggests sellers are still motivated, and more homeowners are exploring their options.
✅ Closed Sales: 58 (Down ~8%)
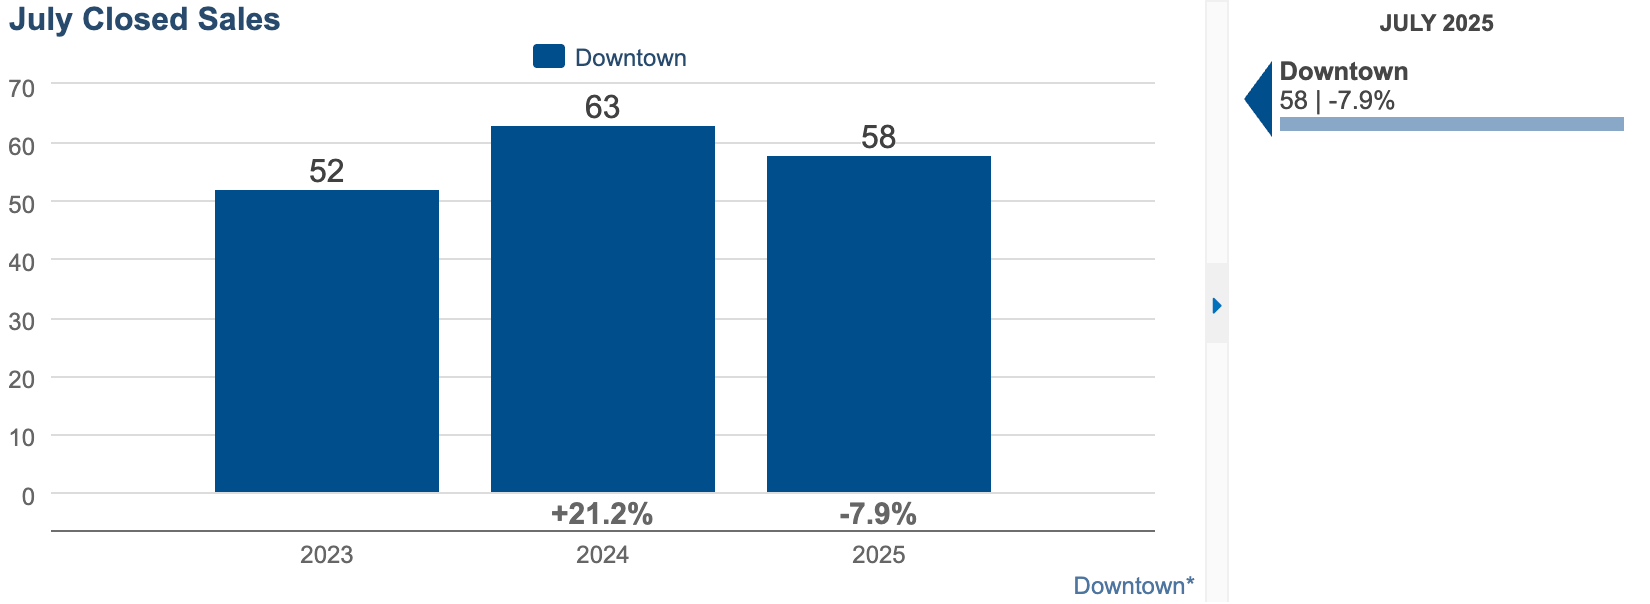
Closed sales declined compared to last July. This could be due to slower spring momentum or cautious buyers adjusting to pricing shifts and economic factors. However, the decline isn’t drastic and indicates a steady if somewhat more deliberate buyer pool.
💲 Median Sales Price: $319,000 (Down 23.7%)
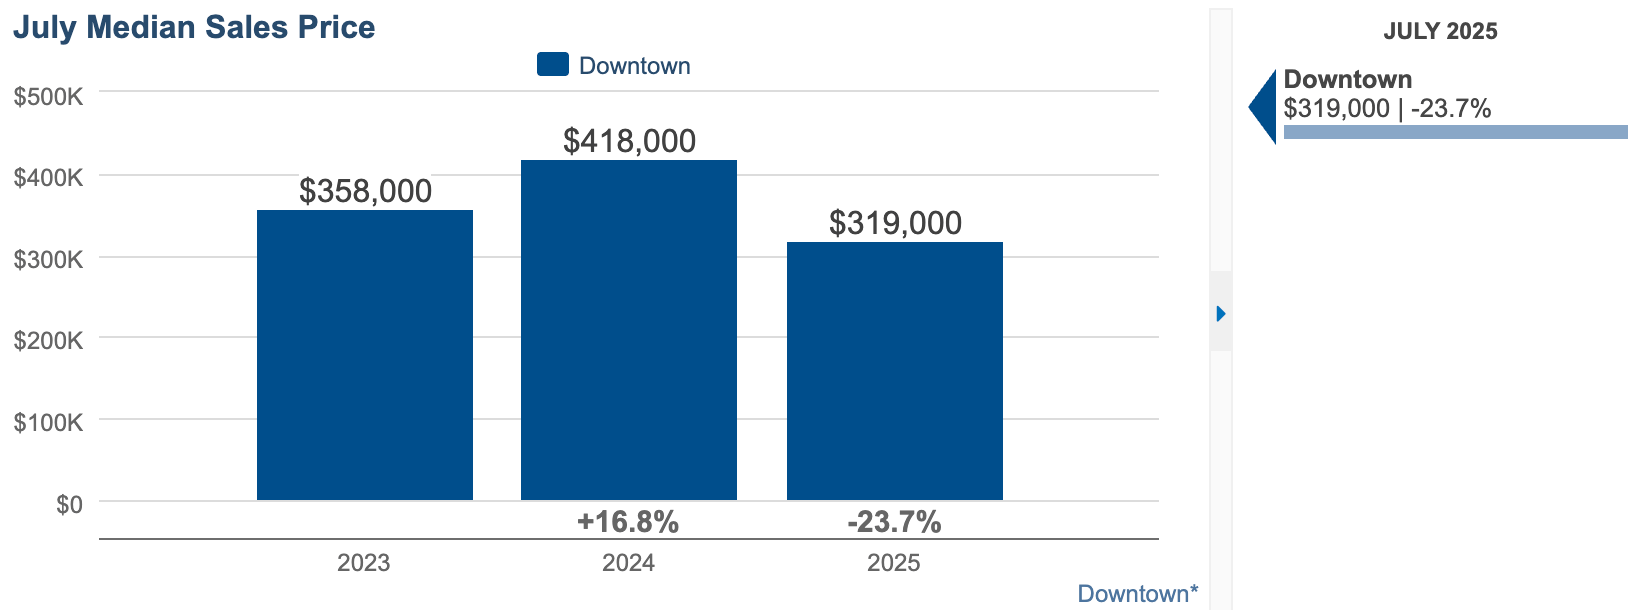
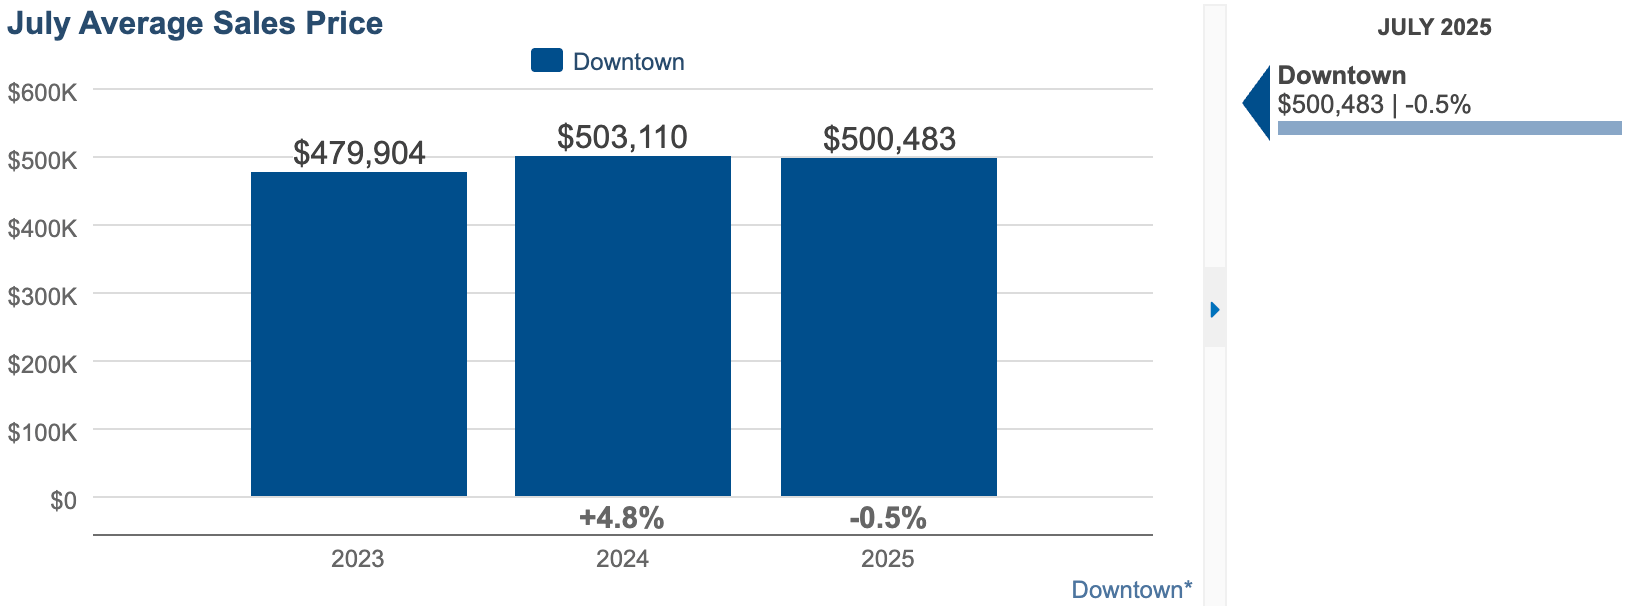
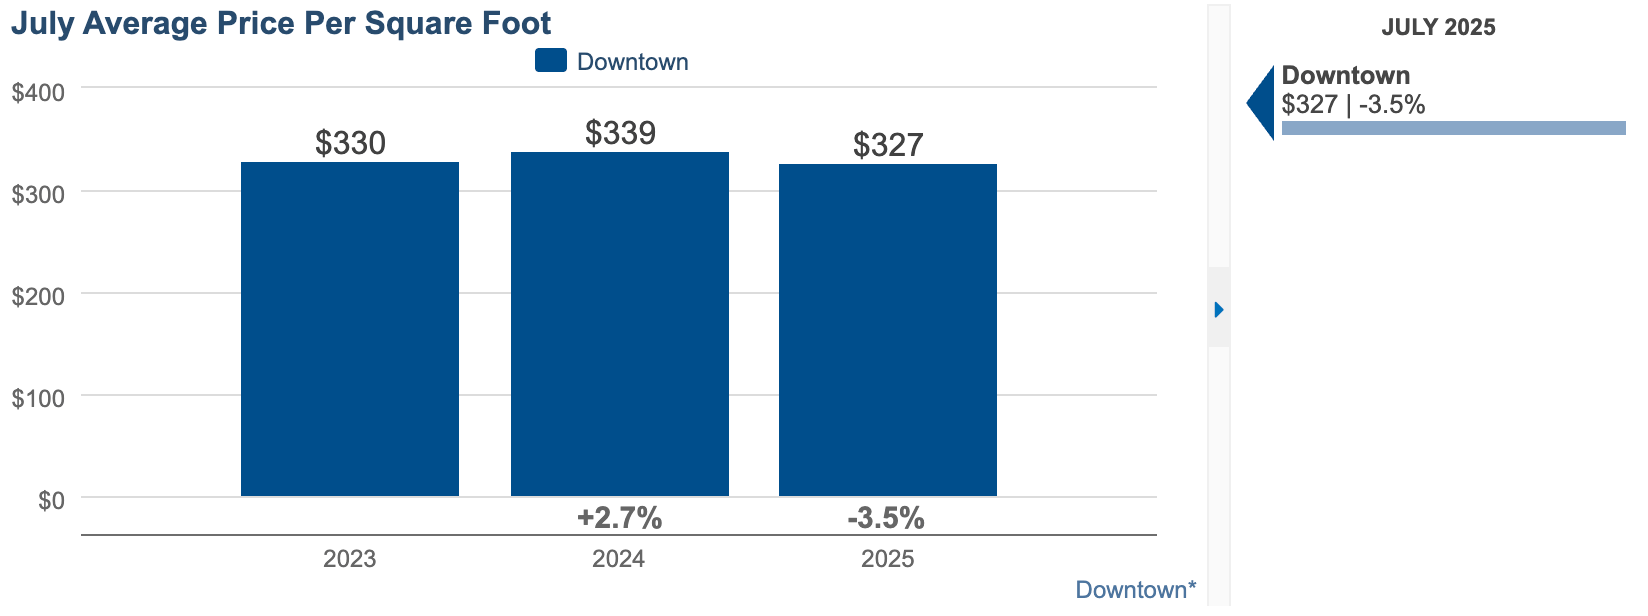
The median sales price saw a steep drop compared to last year. This doesn’t necessarily reflect a market-wide drop in value but rather a shift in the types of homes selling—fewer high-end and luxury properties, and more mid-tier and entry-level units. The average sale price, however, shows a very slight decline comparatively:
📏 Median Price per Square Foot: Down 4%
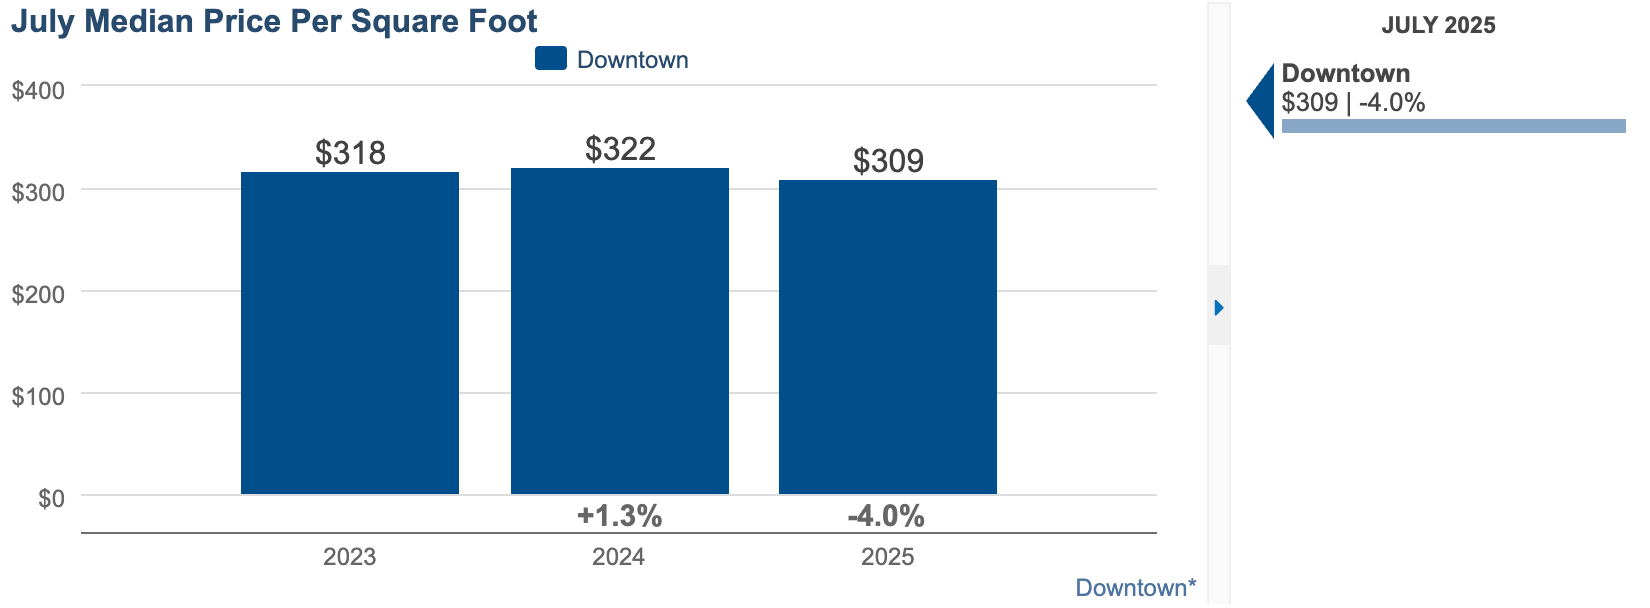
While the total sales price dropped significantly, the price per square foot declined much less. This means homes are still maintaining solid value relative to size. The contrast suggests that smaller or more modest units made up more of July’s sales, rather than a broad decline in property values.
⏳ Median Days on Market: 78 (Up from 42 in July 2024)
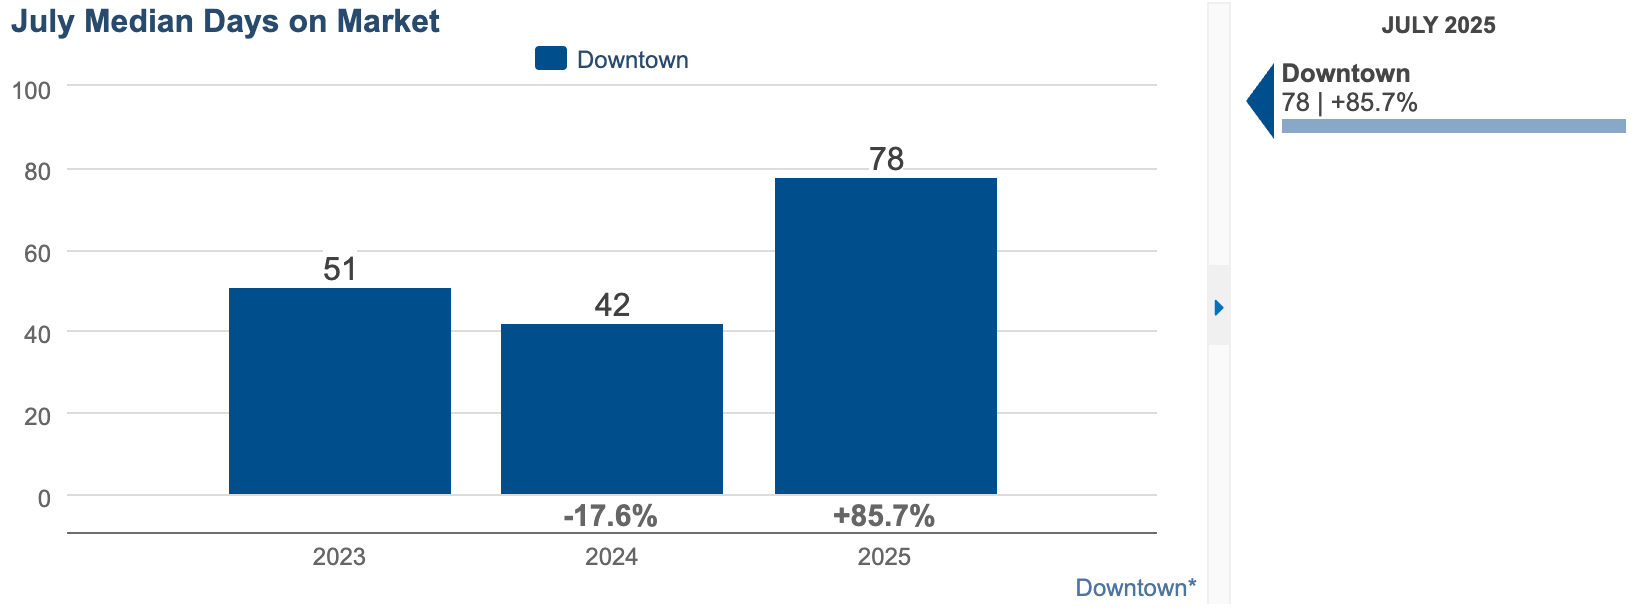
Homes are taking longer to sell, with the average time on the market nearly doubling. This reflects buyer caution, pricing misalignment, or slower decision-making as buyers become more selective in a market that is relatively balanced between supply and demand. More on this below...
🔢 Months Supply: 6.0 Months (Up from 5.9 Months in July 2024)
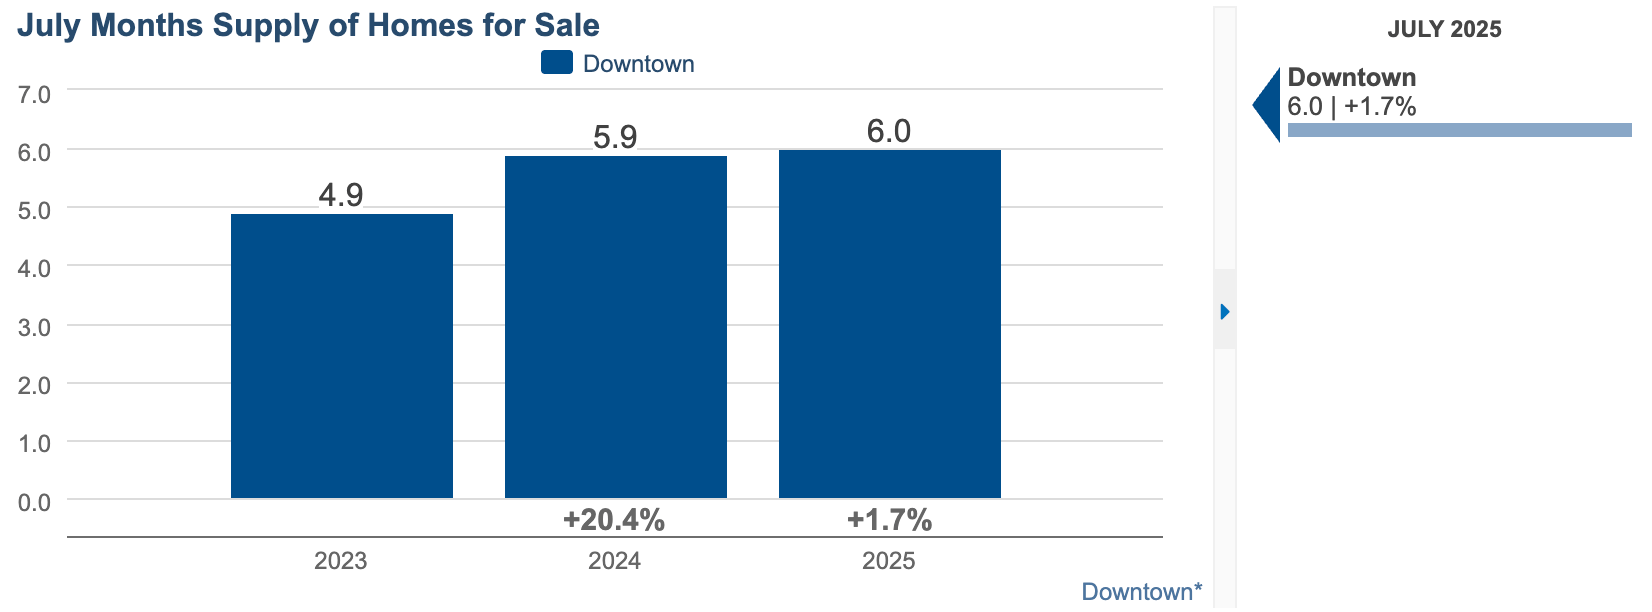
"Months supply" is a key metric that tells us how long it would take to sell all current inventory at the existing pace of sales. A 6-month supply typically signals a balanced market — neither favoring buyers nor sellers. Downtown Minneapolis has hovered near this balance point, and July's slight increase supports the trend toward a more neutral market dynamic.
🔍 Market Insight
Downtown Minneapolis continues to shift toward balance. With more listings and a slightly slower pace, sellers must stay competitive with pricing and presentation. The drop in overall sale price reflects the majority type of inventory moving.
If you're curious about your home’s value or ready to explore your options, let's connect!
REACH OUT TO DISCUSS HOW THESE NUMBERS AFFECT YOUR MARKET TIMING AT [email protected]
Data retrieved from the NorthStarMLS via map of Downtown Minneapolis Neighborhoods including: Loring Park, Elliot Park, Downtown West, Central Minneapolis, North Loop, East Town, Mill District, Nicollet Island, St. Anthony West, and Marcy-Holmes.
HAVE QUESTIONS ABOUT DOWNTOWN MINNEAPOLIS OR SURROUNDING REAL ESTATE MARKETS?
Contact our team by call, email, or submitting a form at: https://lynnburnrealestate.com/